
Figures & data
Figure 1. Schematic illustration of the expression plasmid pET-SUMO-R2C.
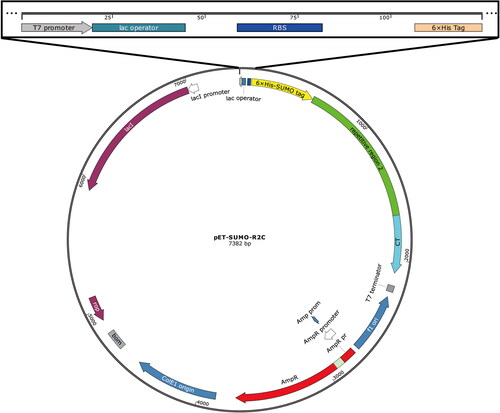
Figure 2. Schematic illustration of the preparation of the electrospun R2C/PLCL scaffolds. (A) Preparation of the electrospinning solutions of R2C/PLCL. (B) Schematic illustration of the electrospinning process. HFIP, 1,1,1,3,3,3-hexafluoro-2-propanol; HVDC, high-voltage direct current.
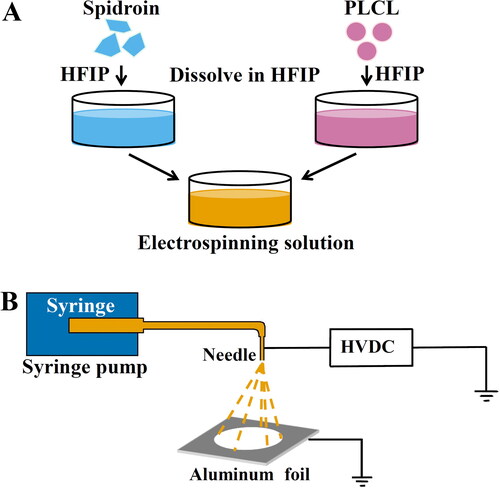
Figure 3. Amino acid sequence of spidroin R2C. The spidroin R2C consists of a Rep2 domain and a CT domain. The DNA sequences of the Rep2 and CT domains were from A. ventricosus MiSp (GeneBank accession number AFV31615.1) and were translated into amino acid sequences via DNAMAN software. The amino acid sequences of Rep2 and CT domains were marked with green and blue shading, respectively.
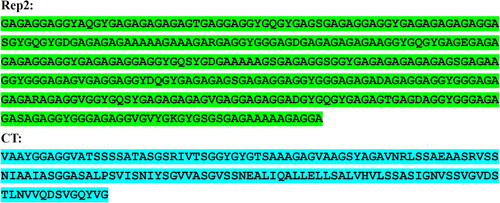
Figure 4. SDS-PAGE analysis of the recombinant spidroin R2C. Lane M, Protein marker (C600525, Sangon, Shanghai, China); lane 1, lysates of uninduced cells; lane 2, lysates of induced cells; lane 3, supernatant of cell lysates; lane 4, pellet of cell lysates; lane 5, flow-through of the Ni-NTA column by passing the supernatants through the Ni-NTA column; lane 6, eluate of Ni-NTA column by using elution buffer; lane 7, fragments after SUMO protease digestion; lane 8, purified spidroin R2C. The target band of spidroin R2C is indicated by the black arrow.
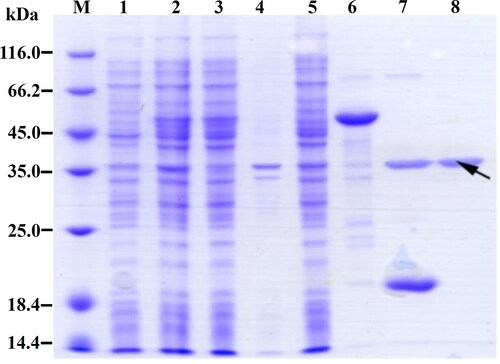
Figure 5. Preparation and mechanical properties of the wet-spun fibers of R2C. (A) Continuous silk-like fibers formed in coagulation solution of 90% methanol. (B) Silk-like fibers more than 10 cm in length. (C) SEM micrography of the wet-spun fiber of R2C using the full backscattered electron detector. The scale bar is 4 μm. (D) Stress-strain curve of the wet-spun fibers of R2C.
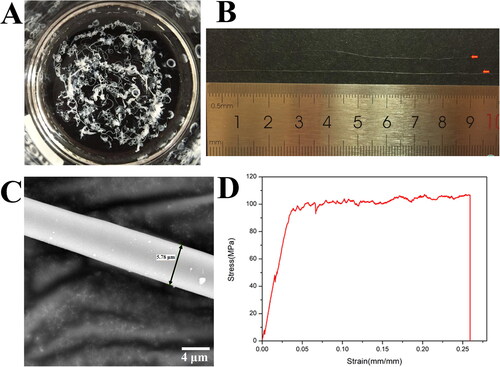
Table 1. Mechanical properties of the wet-spun fibers of R2C.
Figure 6. Preparation of the electrospinning R2C/PLCL scaffolds and their effects on ARPE-19 cells. (A) SEM micrography of the electrospinning R2C/PLCL scaffolds using the full backscattered electron detector. The scale bar is 10 μm. (B) Fiber diameter distribution of the electrospinning R2C/PLCL scaffolds. (C) Volcano plot of differential gene expression after co-culture of ARPE19 cells with membranes. (D) Heatmap of differential gene expression with a threshold of a log2 FoldChange more than 3 and a p adjust value less than 0.05. The volcano plot and heatmap were generated by the online tool of Majorbio Cloud Platform (https://cloud.majorbio.com/page/tools/).
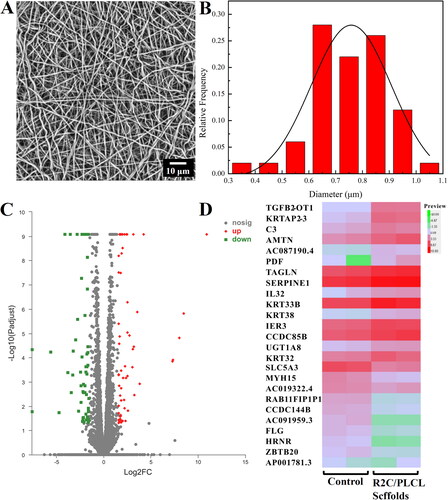
Table 2. Up-regulated genes with a log2 FoldChange more than 3.
Table 3. Down-regulated genes with a log2 FoldChange more than 3.
Supplemental Material
Download PDF (86 KB)Data availability statement
The data that support the findings from this study are available from the corresponding author [EM], upon reasonable request.