
Figures & data
Table 1. Primer sequences for qRT-PCR. The primers for GuWRKY amplification were designed using Primer Premier 5.0 software. The actin primer pair was used according to maroufi [Citation36].
Figure 1. Phylogenetic relationships among the WRKY genes of licorice. A maximum likelihood phylogenetic tree was constructed in MEGA7.0 with bootstrap testing (1000 replicates). the tree divided the WRKY genes into groups I, II and III.
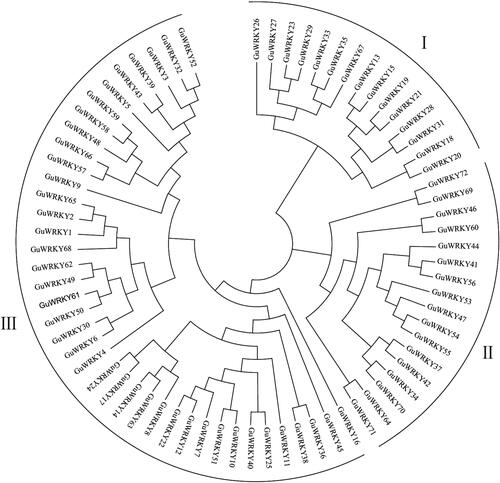
Table 2. Information of GuWRKY genes. The number of amino acids, molecular weight, theoretical isoelectric point, instability index, aliphatic index and grand average of hydropathicity of the GuWRKY proteins were determined using the ProtParam tool in the online ExPASy software [Citation31]. The subcellular localization of these proteins was predicted using the online tool Cell-PLoc 2.0 [Citation32].
Figure 2. Gene structure of GuWRKY genes. The exon/intron structures of GuWRKY genes were visualized using gene structure Display Server 2.0 (GSDS 2.0) [Citation34]. the yellow and green boxes represent the coding sequences (CDS) and the untranslated regions (UTR), respectively. The black lines indicate introns.
![Figure 2. Gene structure of GuWRKY genes. The exon/intron structures of GuWRKY genes were visualized using gene structure Display Server 2.0 (GSDS 2.0) [Citation34]. the yellow and green boxes represent the coding sequences (CDS) and the untranslated regions (UTR), respectively. The black lines indicate introns.](/cms/asset/7f51411e-d610-4838-8f27-2db6b57d483a/tbeq_a_2225653_f0002_c.jpg)
Figure 3. Conserved motifs of GuWRKY proteins of groups I, II and III. MEME predicted a total of ten motifs shown in different colors. Gray lines represent non-conserved sequences.
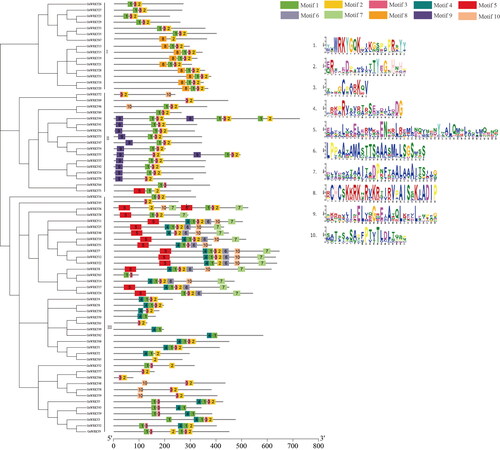
Figure 4. Cis-acting elements of GuWRKY genes. The PlantCARE database was used to predict the cis-regulatory elements 2.0 kb upstream of the start codon of each gene. Here, the x-axis shows the type of cis-acting elements, and the y-axis indicates the number of WRKY family members.
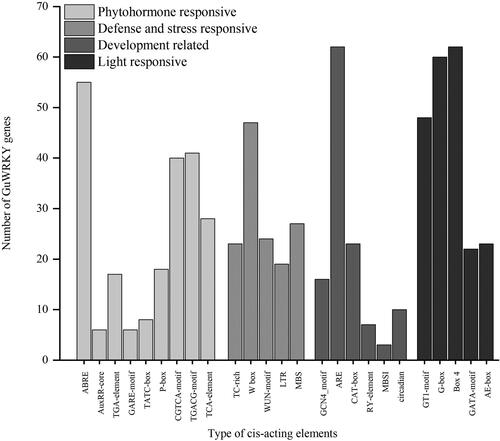
Figure 5. Relative expression of 10 GuWRKYs in root under low temperature, salt and drought treatments. The y-axis indicates the relative expression levels of GuWRKY genes using the 2−ΔΔCT method. The x-axis represents the RNA samples from the roots in different treatments at four time points (3 h, 6 h, 12 h, 24 h), from left to right: CK (normal growth), cold (4 °C low temperature treatment), NaCl (150 mmol·L−1 NaCl salt treatment), PEG (15% PEG-6000 drought treatment). Actin was used as the internal reference gene for specific expression analysis. Data shown are mean values ± SEM (n = 3). different capital letters indicate significant differences among the different time points under the same treatment at 0.05 level, and different lowercase letters indicate significant differences among the treatments at the same time point at 0.05 level (LSD test).
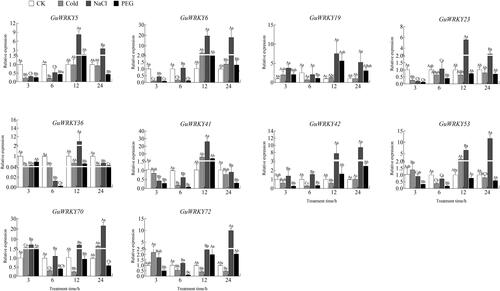
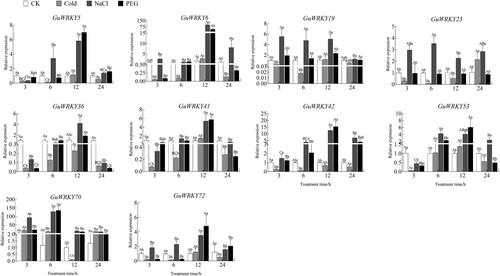
Figure 6. Relative expression of 10 GuWRKYs in stem under low temperature, salt and drought treatments. The y-axis indicates the relative expression levels of GuWRKY genes using the 2−ΔΔCT method. The x-axis represents the RNA samples from the stems in different treatment at four time points (3 h, 6 h, 12 h, 24 h), from left to right: CK (normal growth), cold (4 °C low temperature treatment), NaCl (150 mmol·L−1 NaCl salt treatment), PEG (15% PEG-6000 drought treatment). Actin was used as the internal reference gene for specific expression analysis. Data are shown as mean vales ± SEM (n = 3). different capital letters indicate significant differences among the different time points under the same treatment at 0.05 level, and different lowercase letters indicate significant differences among the treatments at the same time point at 0.05 level (LSD test).
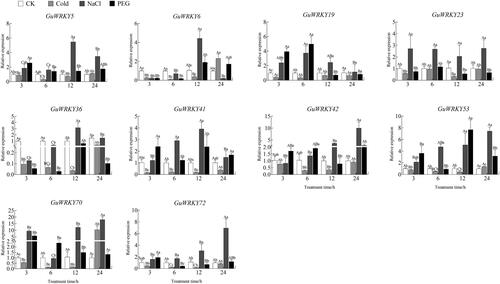
Figure 7. Relative expression of 10 GuWRKYs in leaves under low temperature, salt and drought treatments. The y-axis indicates the relative expression levels of GuWRKY genes using the 2−ΔΔCT method. The x-axis represents the RNA samples from the leaves in different treatment at four time points (3 h, 6 h, 12 h, 24 h), from left to right: CK (normal growth), cold (4 °C low temperature treatment), NaCl (150 mmol·L−1 NaCl salt treatment), PEG (15% PEG-6000 drought treatment). Actin was used as the internal reference gene for specific expression analysis. Data are shown as mean values ± SEM (n = 3). different capital letters indicate significant differences among the different time points under the same treatment at 0.05 level, and different lowercase letters indicate significant differences among the treatments at the same time point at 0.05 level (LSD test).
Supplemental Material
Download PDF (186.4 KB)Data availability statement
The data that support the findings reported in this study are available from the corresponding author (GJ) on reasonable request.