
Figures & data
Table 1. Primers used in this study.
Figure 1. Phylogenetic analyses of soybean BBM gene subfamily members and prediction of BBM protein structure. (A) Phylogenetic analysis of Glycine max, Arabidopsis thaliana, Zea mays, Oryza sativa and Phaseolus vulgaris (phylogenetic tree analysis by maximum likelihood method using MEGA software); (B) Domain analysis of soybean and Arabidopsis BBM proteins, soybean and Arabidopsis BBM protein length and AP2 domain information were derived from the Phytozome database and plotted using IBS 2.0 and PowerPoint 2016. The predicted AP2 domain (PF00847) is depicted as a teal square.
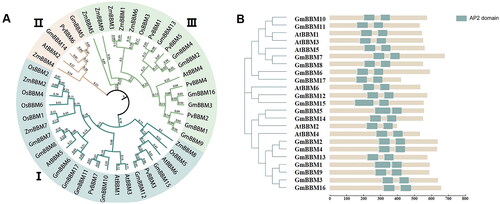
Table 2. Basic information of soybean BBM gene family.
Figure 2. Gene collinearity and exon–intron structure analysis of members of the GmBBM gene subfamily. (A) Collinearity analysis of BBM genes of G. max, A. thaliana, Z. mays, O. sativa, and P. vulgaris. Collinearity analysis between different species was performed using the R circos code, and the chromosomes of the above species are depicted in a circular form for ease of presentation. Coloured curves indicate collinear regions of BBM; (B) Exon–intron schematic diagram of AtBBM and GmBBM. Exons and introns of BBM genes in soybean and Arabidopsis were obtained from the Phytozome database, and the gene structure was analyzed using the online tool GSDS 2.0. Untranslated region (UTR) sequences are represented by green squares. Exons and introns are indicated as pink boxes and dashed lines, respectively.
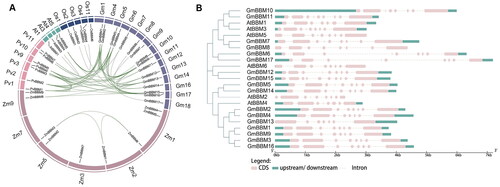
Figure 3. Prediction of cis-elements in the 1.5-kb promoter region upstream from the start codon of GmBBMs. The upstream 1.5-kb sequences of GmBBMs were obtained from the Phytozome database, the key cis-elements were predicted using PlantCARE database, and the visualization was done using IBS 2.0. The relative positions of cis-elements in each GmBBM gene are marked by boxes of different colours.
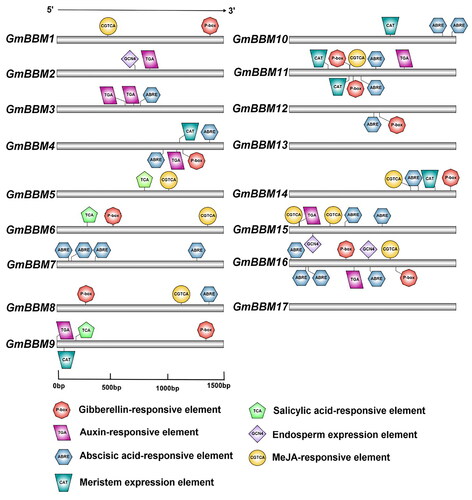
Figure 4. Analysis of the expression patterns of GmBBM gene subfamily members. The expression data of GmBBM gene subfamily in different tissues were obtained from the Phytozome database. TBtools software was used to map the expression patterns of GmBBM gene subfamily members. The abscissa represents the flowers, leaves, nodules, pod, root, roots hairs, seed, shoot apical meristem, and stems. The ordinate represents the members of the GmBBM gene subfamily. The color scale represents the expression value of log2.
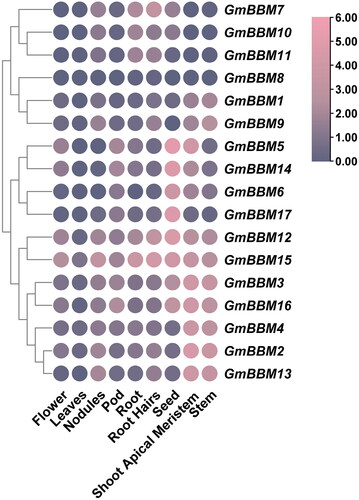
Figure 5. Molecular characterization analysis of GmBBM7. (A) Tissue-specific expression analysis of GmBBM7. The abscissa indicates various tissues (root, stem, leaf, callus, embryo and grain) of soybean variety SN14, and the ordinate represents the expression level relative to the housekeeping gene Actin4; (B) Subcellular localization analysis of GmBBM7. Confocal microscopy showing GmBBM7-GFP fluorescence (1), nuclear protein marker-AHL22 (2), chloroplast autofluorescence (3), corresponding bright field (4), and accordingly merged pictures (5).
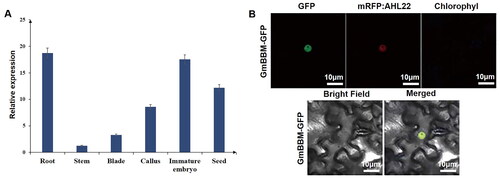
Figure 6. Effects of GmBBM7 overexpression on the growth and development of soybean callus and root. (A) The left panels are the roots and calli of hairy roots overexpressing GmBBM7 (OE), and the right panels are the roots and calli of wild-type (WT) hairy roots; (B) the left panel shows hairy roots overexpressing GmBBM7 and the right panel shows WT hairy roots, both cultured for 8 days from the second day of rooting; (C) the relative expression levels of GmBBM7 in OE and WT hairy roots (hairy roots cultured to 8d from OE and WT materials); (D) callus density in OE and WT hairy roots (Calli were cultured with OE and WT materials for 45 days). the ordinate is callus density (g cm−3); (E) Callus formation rate in OE and WT hairy roots (Calli were cultured with OE and WT materials for 45 days). the ordinate is the callus formation rate (%); (F) growth rate of OE and WT hairy roots (hairy roots cultured to 8d from OE and WT materials). the ordinate is the growth rate of hairy roots (g·g−1 d−1); (G) the growth rate of the tap root of OE and WT hairy roots. The abscissa is the number of days (0–2, 2–4, 4–6, and 6–8 days). the vertical axis is the growth rate of tap root of hairy roots (cm cm−1 d−1) (**p < 0.01).
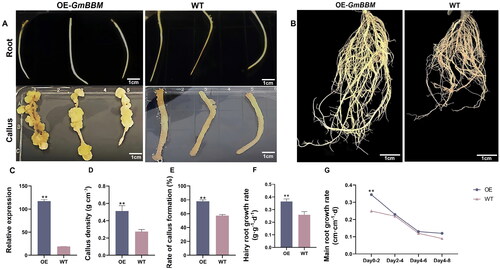
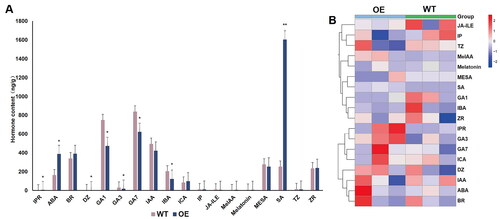
Figure 7. Determination of hormonal levels in WT and GmBBM7-overexpressing transgenic hairy root calli (Calli were cultured with OE and WT materials for 45 days). (A) One-way analysis of variance of OE and WT calli. horizontal and vertical scales are the names of the tested hormones. vertical axis indicates the hormonal content (ng g−1). IPR (Isopentenyladenine riboside), ABA (Abscisic acid), BR (brassinolide), DZ (Dihydrozeatin), GA1 (gibberellin A1), GA3 (gibberellin A3), GA7 (gibberellin A7), IAA (Indole-3-acetic acid), IBA (3-Indolebutyric acid), Ica (Indole-3-carboxaldehyde), IP (N6-Isopentenyladenine), JA-ILE (Jasmonoyl-L-Isoleucine), MeIAA (methyl indole-3-acetate), Melatonin (Melatonin), MESA (methylsalicylate), SA (Salicylic acid), TZ (trans-Zeatin), ZR (trans-Zeatin-riboside); (B) Hierarchical clustering analysis of the heat map of hormonal content corresponding to ; the first three columns are the 3 repetitions of the OE test sample, and the last three columns are the 3 repetitions of the WT test sample, each box in the heat map represents the relative abundance of the corresponding hormone in the corresponding sample, red represents the increase of the relative hormone content, blue represents the decrease of the relative hormone content, and the depth of the color represents the magnitude of the difference. (*p < 0.05, **p < 0.01), the hierarchical clustering analysis was plotted using TBtools software.
Supplemental Material
Download PDF (3 MB)Data availability statement
All data that support the findings reported in this study are available from the corresponding author upon reasonable request.