
Figures & data
Figure 1. Chemical structure of HP (parent molecule).
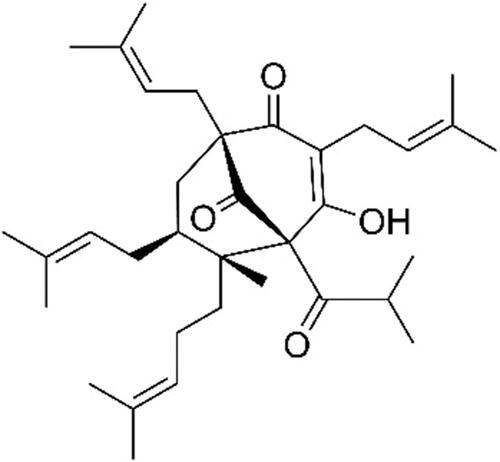
Table 1. Numbers and structure of predicted metabolites of HP obtained via ‘skin metabolism’ simulator.
Table 2. In silico-predicted binding of HP metabolites to DNA, proteins, and protein binding for skin sensitization.
Table 3. Carcinogenicity (genotoxic and nongenotoxic), in vitro mutagenicity (Ames test), and in vivo mutagenicity (Ames test) of HP metabolites predicted via in silico studies.
Figure 2. Plasma oxidative status parameters of healthy unwounded animals (C), nontreated wounded animals (negative control; G0), animals treated with a commercially available product (positive control; G1), animals treated with bigel containing St. John’s wort extract rich in hyperforin (G2), and animals treated with bigel containing nanoencapsulated hyperforin-rich St. John’s wort extract (loaded in nanostructured lipid carriers) (G3). Results are obtained at the 2nd, 7th, 14th, and 21st post-operative days. Subfigure a represents the antioxidant capacity measured by the ABTS method, and Subfigure B represents the MDA concentration. Asterisks and letters indicate statistically significant differences: * vs. C; a vs. G0, b vs. G1, and c vs. G2. Values are means ± SD (n = 3).
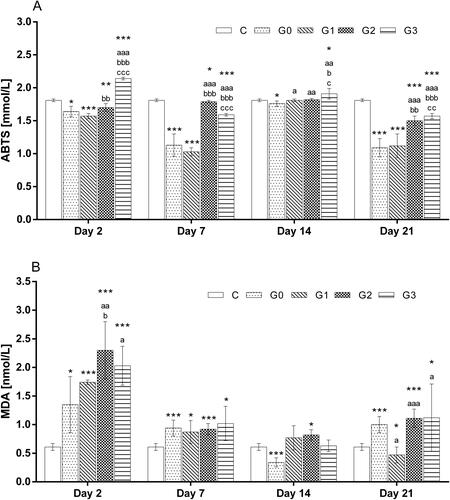
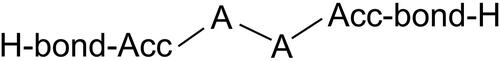
Figure 3. Structural alert for H-acceptor-path3-H-acceptor. Any atom except hydrogen is marked as ‘A,’ and ‘H-bond-Acc’ represents any atom that is a potential hydrogen bond acceptor.
Supplemental Material
Download PDF (535.1 KB)Data availability statement
All data are available from the corresponding author upon reasonable request.