
Figures & data
Table 1. Matrix of experimental design.
Figure 1. Morphology of CA01 strain observed by CETI optical microscope equipped with a camera at G100. (A) Micromorphology (B) Macromorphology.
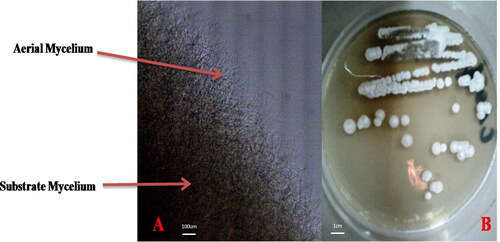
Table 2. Biochemical, physiological and morphological characteristics of the isolated CA01 strain [Citation9].
Figure 2. Phylogenetic tree of molecular identification after sequencing of 16s rDNAgene using Sanger method of sequencing and alignment by CHROMAS Pro software. QRY_Contig_CA01-16S-Complet_2ND_ENVOI: our studied strain.
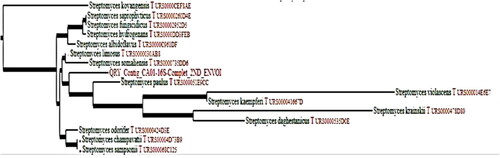
Figure 3. Illustration of the L-Asparaginase activity of intracellular protein fraction of Streptomyces paulus CA01 strain, demonstrated by the diffusion on wells approach. C: Negative control: sterile ADS medium; I: intracellular protein fraction of Streptomyces paulus CA01strain.
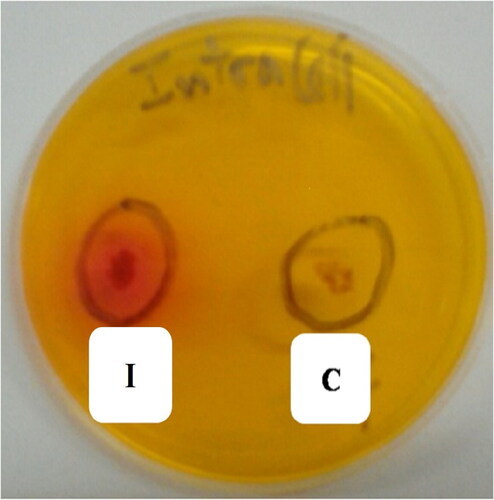
Table 3. Coded coefficients for transformed response.
Table 4. Analysis of variance for transformed response.
Figure 4. Surface plot illustration of the effect of interaction of the selected factors (T, temperature; SC, substrate concentration; GC, glucose concentration) on the L-asparaginase production by Streptomyces paulus CA01 using Minitab 17 software.
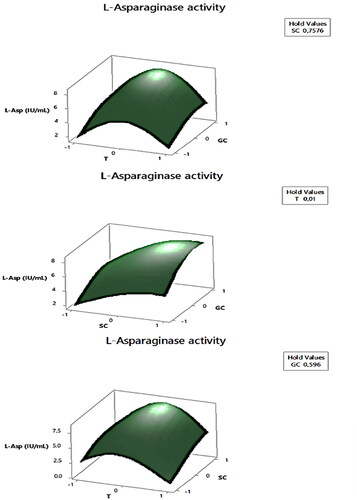
Figure 5. Optimization of the intracellular L-Asparaginase production by the Streptomyces paulus CA01 strain.
T: temperature; SC: Substrate concentration; GC: Glucose concentration.
Note: The equation of the coded values of the model is:
(3)
(3)
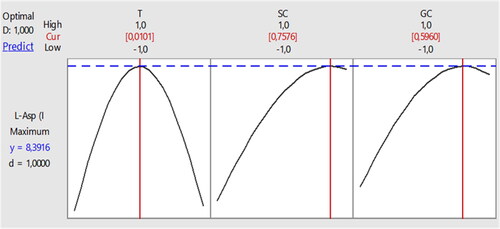
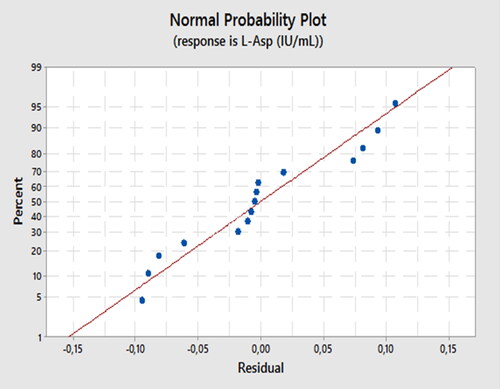
Figure 6. Normal plot for the experimental response.
Data availability statement
All data generated or analyzed during the current study are available from the corresponding author (M. S. B) on reasonable request.