
Figures & data
Figure 1. Callus and tissue culture seedlings of Lavandula angustifolia.
Note: Subculture for two weeks after successful induction of callus and tissue culture seedlings.
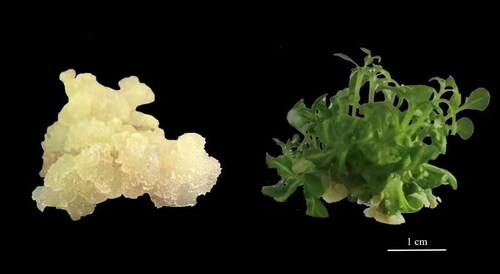
Table 1. List of primers for real-time fluorescence quantification.
Figure 2. Comparison of different essential oil contents between callus and tissue culture seedlings of Lavandula angustifolia. p < 0.05.
Note: Callus: Callus in tissue culture; Seedling: Tissue Cultured Seedling.
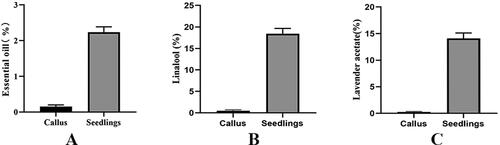
Table 2. Quality of sequencing data.
Figure 3. Validation of the gene expression levels estimated from RNA sequencing (RNA-Seq) data using quantitative real-time PCR (qRT-PCR) and six target genes of lavandula angustifolia. Different letters represent significant differences between different groups (p < 0.05).
Note: Callus: Callus in tissue culture; Seedling: Tissue Cultured Seedling
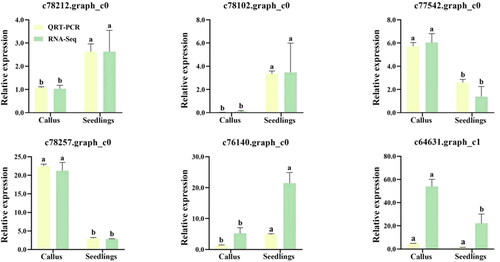
Figure 4. Gene ontology (GO) analysis of DEGs in callus and tissue culture seedlings of Lavandula angustifolia.
Note: DEG: differentially expressed gene. X-axis shows GO terms. Y-axis on the left shows the percentage of the genes annotated to this term in total number of annotated genes. The Y-axis on the right shows the number of genes annotated to the term.The topGO version 2.28.0 was used to analyze the data. (http://www.bioconductor.org/packages/release/bioc/html/topGO.html).
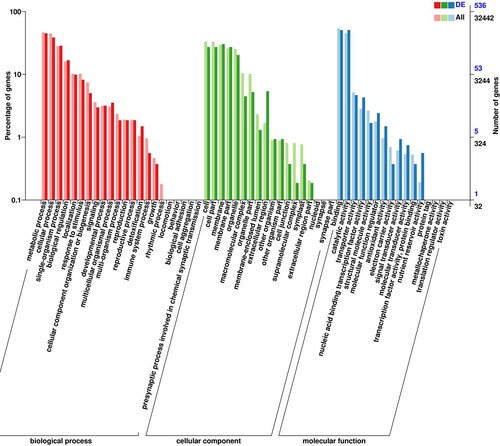
Figure 5. COG annotation statistics of differentially expressed genes of Lavandula angustifolia.
Note: The X-axis represents the COG term, and the Y-axis represents the number of genes.
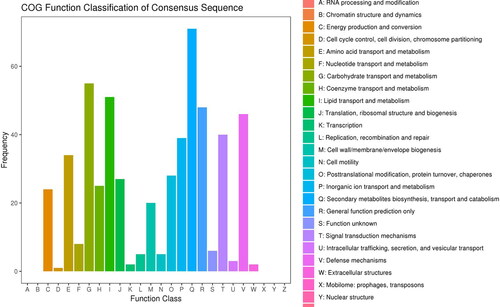
Figure 6. KEGG pathway enrichment analysis of DEGs of Lavandula angustifolia.
A: up-regulated genes; B: down-regulated genes.
Note; Each dot represents a KEGG pathway. Y-axis is -log10 (Q-value) and X-axis is the enrichment factor. The larger the factor is, the higher the enrichment level of the pathway. The color of the dots represents the q-value (adjusted p-value). A smaller q-value indicates a more significant or reliable enrichment. The size of the dots represents the number of DEGs enriched in this pathway. The larger the dot, the more genes it contains.
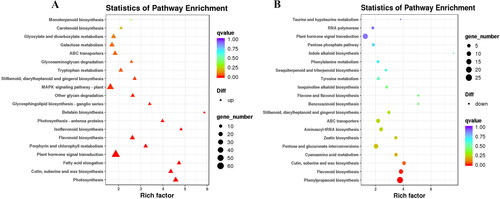
Figure 7. Potential regulatory mechanisms of terpene biosynthesis in callus and tissue culture seedlings of Lavandula angustifolia.
Note: Red indicates up-regulated genes, Green indicates down-regulated genes. See also Supplemental Table S1.
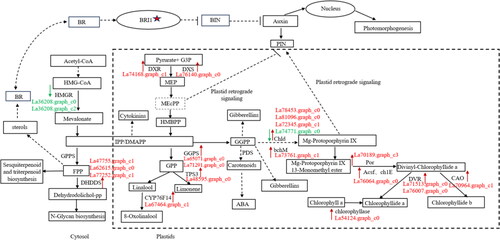
Figure 8. Carbohydrate metabolism and transformation in lavandula angustifolia callus and tissue culture seedlings (source of G3P, Acetyl-CoA, pyruvate).
Note: Red indicates up-regulated genes, Green indicates down-regulated genes. See also Supplemental Table S1.
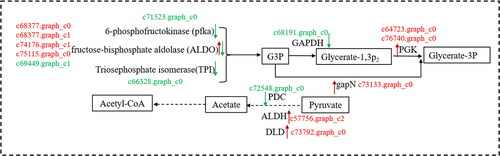
Figure 9. Differentially expressed genes of hormone metabolic pathways in callus and tissue culture seedlings of Lavandula angustifolia.
Note: Red indicates up-regulated genes, Green indicates down-regulated genes. See also Supplemental Table S1.
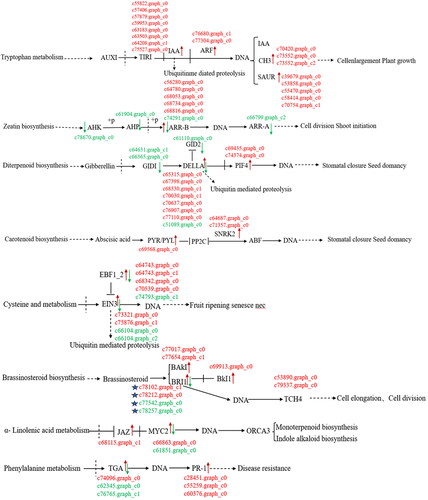
Figure 10. Phylogenetic tree of lavandula angustifolia and Arabidopsis thaliana.
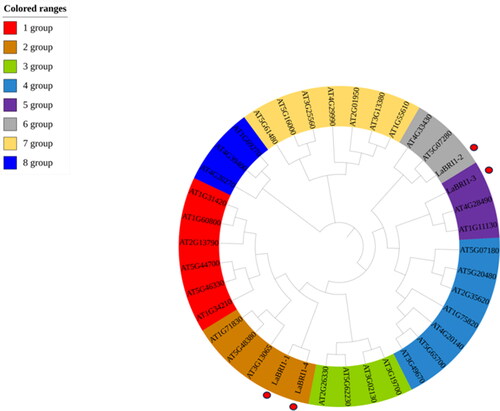
Figure 11. Conserved motif and conserved structure of LaBRI1 gene.
Note: A: Conserved motif of LaBRI1 gene B: Conserved structure of LaBRI1 gene.
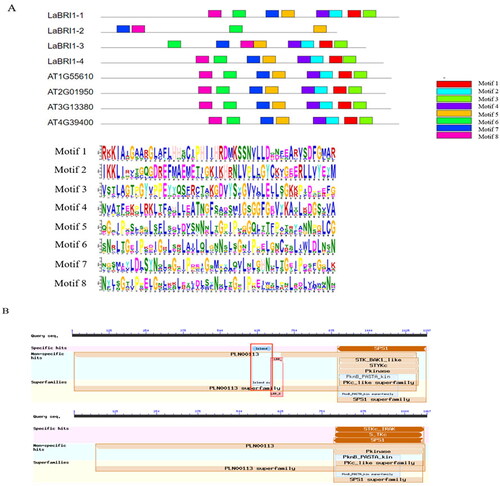
Table 3. Predicted physicochemical properties of four BRI1 proteins in Lavandula angustifolia.
Supplemental Material
Download MS Word (16.4 KB)Data availability statement
All RNA-Seq raw data used in this study were deposited in the Sequence Read Archive (SRA) at NCBI under the accession number PRJNA929460 (https://www.ncbi.nlm.nih.gov/bioproject/PRJNA929460). All other data that support the findings reported in this study are available from the corresponding author [HM] upon reasonable request.