Figures & data
Table 1. Summary of response rates and key findings from surveys of stalking experiences of parliamentarians with similar methodologies.
Figure 1. Age of survey respondents.
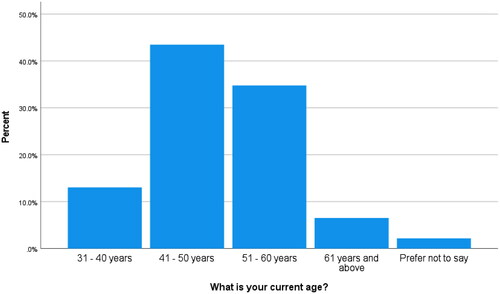
Figure 2. Number of years in Parliament of survey respondents.
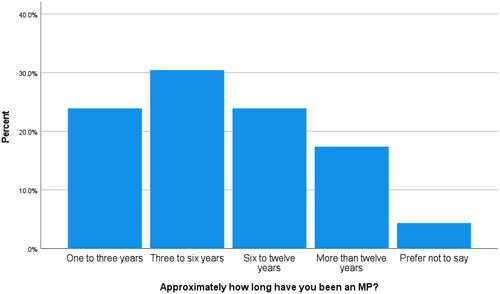
Figure 3. Political alignment of survey respondents, progressive to conservative. Each dot represents a participant, plotting their stated level of progressive politics against their stated level of conservative politics.
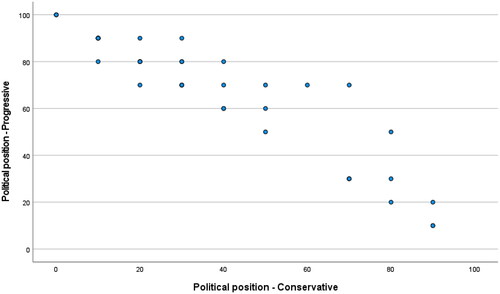
Figure 4. Number of different people responsible for unwanted approach/persistent contact.
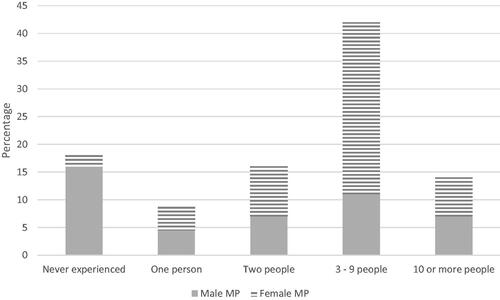
Figure 5. Number of times MPs experienced threats.
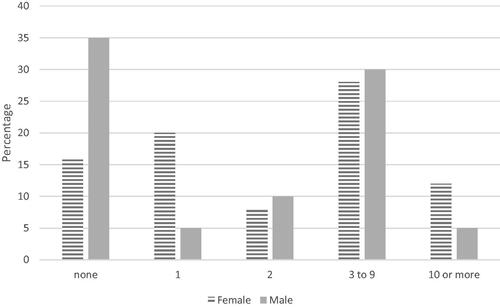
Figure 6. Percentage of MPs reporting abuse or threats on various topics.
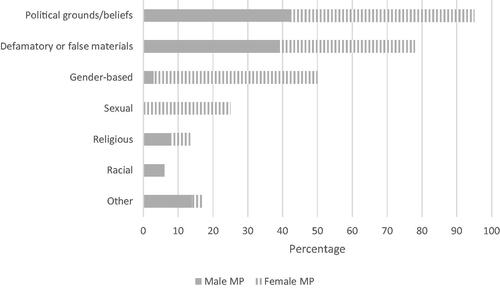
Figure 7. Reported responses to online abuse and threats.
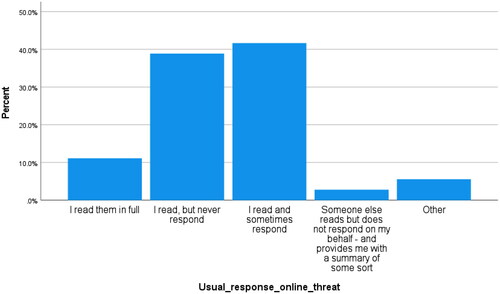
Figure 8. Percentage of MPs who reported lifestyle changes in response to unwanted approaches, threats, stalking, harassment and online abuse.
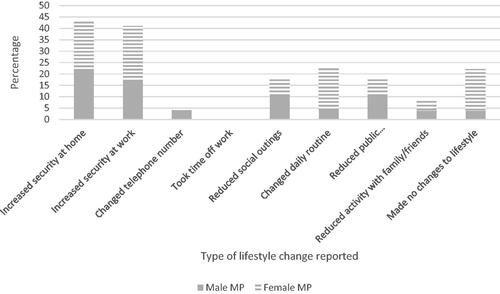
Figure 9. Percentage of MPs reporting concern or fear as a consequence of their experiences.
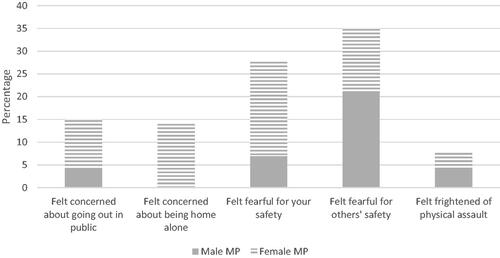
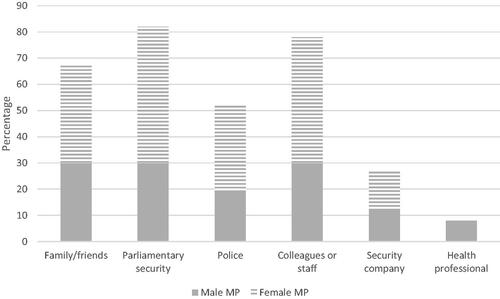
Figure 10. Percentage of MPs who sought assistance and from where.