
Figures & data
Table 1. Time between when the assessments were conducted relative to release from prison.
Table 2. Descriptive statistics of the LSI–R:SV, LS/RNR and HCR–20V3.
Table 3. Recidivism outcomes by total sample and risk measure sub-sample.
Figure 1. Survival curves in the LSI-R:SV sample, LS/RNR sample, and HCR-20V3 sample depicting the probability of surviving (i.e., not recidivating) for any (top), violent (middle), and non-violent (bottom) recidivism according to risk classification.
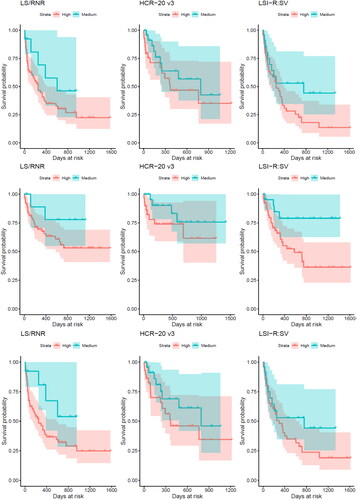
Table 4. Recidivism Outcomes by Risk Level on the LSI–R:SV, LS/RNR and HCR–20V3.
Table 5. Cox regression survival analysis and AUCs of the LSI–R:SV, LS/RNR, total scores and LS/RNR subscales for recidivism outcomes.
Table 6. Cox regression survival analysis and AUCs of the HCR–20V3 total score and H-Scale score for all recidivism outcomes.
Table 7. Sensitivity, specificity, positive predictive value and negative predictive value metrics for the measures at different cut-offs at 360 days at risk.