
Figures & data
Figure 1. The visual procedure of consensus decision-making model with endo-confidence.
Source: calculated by the methods using the original data.
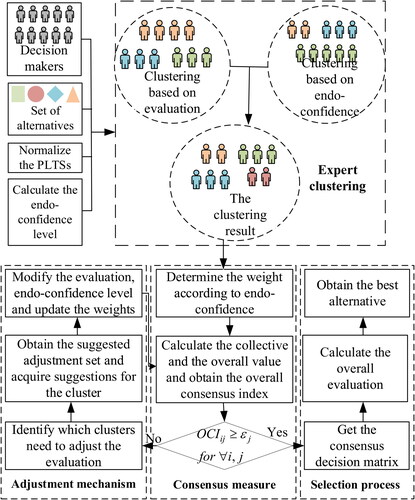
Table 1. The clustering results and the corresponding weights and endo-confidence levels.
Table 2. The results of the updated weights.
Table 3. The comparative results of Model I (case I and case II) and Model II.
Table A1. The meaning of notations used in the proposed model.