Figures & data
Table 1. Sales figures for double 11 OSC in 2020.
Figure 1. Research model of customer reactions centred on satisfaction in online shopping carnivals. Source: from literature.
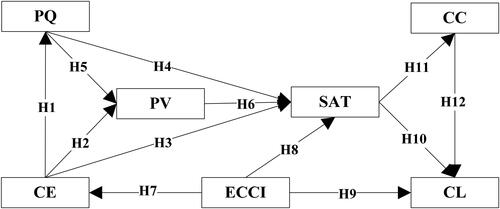
Table 2. Measurement model assessment.
Table 3. Discriminant validity analysis.
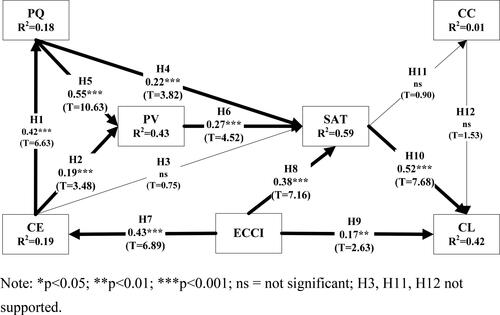
Figure 2. Research model path coefficients, their significance levels and T values. Source: The authors.
Note: *p < 0.05; **p < 0.01; ***p < 0.001; ns = not significant; H3, H11, H12 not supported