
Figures & data
Table 1. Data description and source.
Figure 1. The graphical plots of the natural logarithms of FOOT, PGDP, and EC.
Source: generated by the authors.
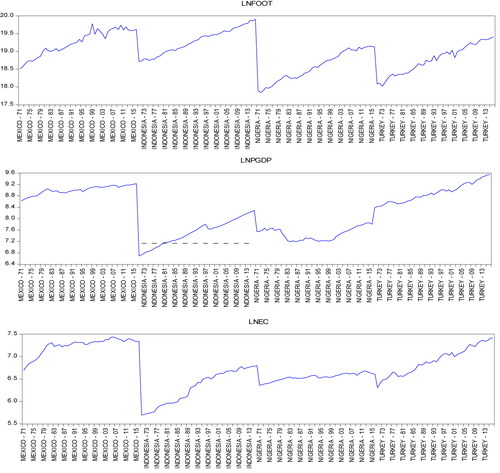
Table 2. Cross-sectionally independent panel unit root tests.
Table 3. Bai & Ng's panel unit root tests with cross-sectional dependence-PANIC.
Table 4. Pesaran's panel unit root tests with cross-sectional dependence-CIPS.
Table 5. Pedroni residual cointegration test.
Table 6. Johansen Fisher panel cointegration test.
Table 7. VAR lag size criteria.
Table 8. Vector error correction model estimates (α and β vectors).
Table 9. Short term estimates (t-statistics in [ ]).
Figure 2. Impulse response functions.
Source: generated by the authors.
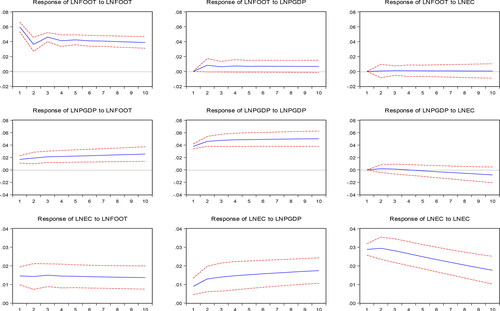
Table 10. The Wald test results for long-term relationship among variables.
Table 11. VEC granger causality/block exogeneity Wald tests.
Table 12. DOLS and FMOLS estimators.