
Figures & data
Figure 1. Multiple-attribute group decision-making process for project financing.
Source: drawn by authors themselves.
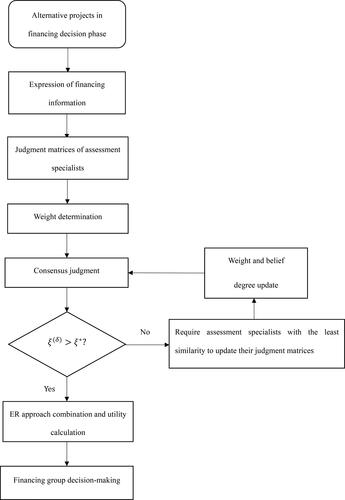
Table 1. Evaluation index system of the financing scheme.
Table 2. Expert ’s evaluation of each scheme.
(1)Comprehensive Index
(2)Comprehensive Index
(3)Comprehensive Index
(4)Comprehensive Index
Table 3. Evaluation experts’ subjective weights for the evaluation indexes.
Table 4. Similarities between experts’ judgments.
Table 5. Evaluation expert weights and consensus coefficient.
Table 6. Expert ’s evaluation of each scheme.
(1)Comprehensive Index
(2)Comprehensive Index
(3)Comprehensive Index
(4)Comprehensive Index
Table 7. Revised similarities between experts.
Table 8. Revised evaluation expert weights and consensus coefficient.
Table 9. Attributes’ relative weights.
Table 10. Comprehensive evaluation results provided by evaluation experts.
Table 11. Final utility value of each scheme.
Table 12. Final score of each scheme without interaction.
Table 13. Final score of each financing scheme.
Table 14. Ordering between schemes with different
Table 15. Ordering between schemes with different
Table 16. Ordering between schemes with different approaches.
Table A1. Expert ’s evaluation of each scheme.
(1)Comprehensive Index
(2)Comprehensive Index
(3)Comprehensive Index
(4)Comprehensive Index
Table A2. Expert ’s evaluation of each scheme.
(1)Comprehensive Index
(2)Comprehensive Index
(3)Comprehensive Index
(4)Comprehensive Index
Table A3. Expert ’s evaluation of each scheme.
(1)Comprehensive Index
(2)Comprehensive Index
(3)Comprehensive Index
(4)Comprehensive Index