
Figures & data
Figure 1. The procedure for transforming the time-series data into the encoding GAF images.
Source: The authors’ illustration.

Figure 2. The architecture of hybrid deep neural network model (HDNN).
Source: The authors’ illustration.
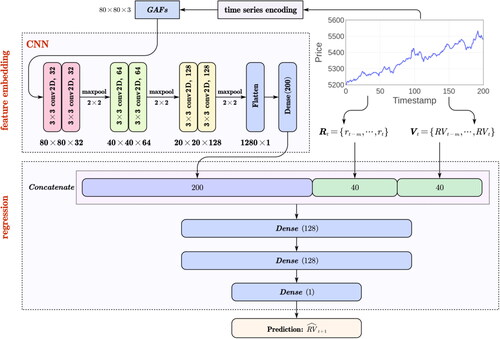
Figure 3. The procedure of time-series cross-validation on rolling windows.
Source: The authors’ illustration.
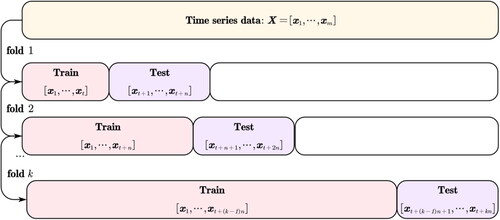
Figure 4. The illustration of four types of GBM time-series datasets.
Source: The authors’ illustration.
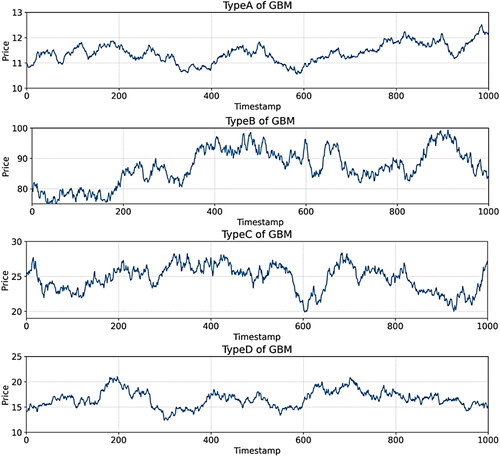
Table 1. The statistics of realised volatility for the four GBM time-series datasets.
Table 2. The forecasting results of each regressor on the four GBM time-series datasets, in terms of the five metrics.
Figure 5. The illustration of CSI300, SSE50, ChiNext, S&P 500, and NASDAQ datasets.
Source: The authors’ illustration.
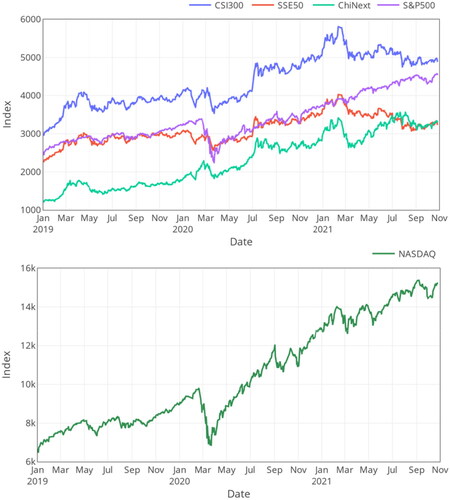
Figure 6. The log returns (left) and realized volatility (right) of CSI300 index in 2020.
Source: The authors’ illustration.
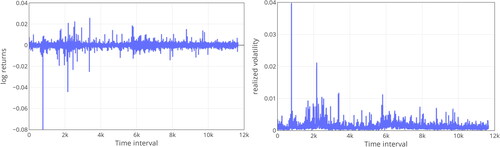
Table 3. The statistics of realized volatility for the five Stock Index datasets.
Figure 7. The RMSE metric of regressors on the five Stock Index datasets.
Source: The authors’ illustration.
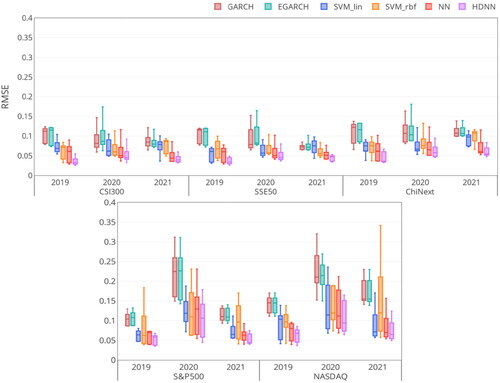
Figure 8. The MAD metric of regressors on the five Stock Index datasets.
Source: The authors’ illustration.
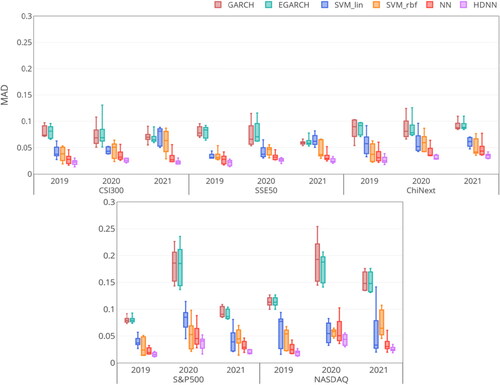
Figure 9. The MedAD metric of regressors on the five Stock Index datasets.
Source: The authors’ illustration.
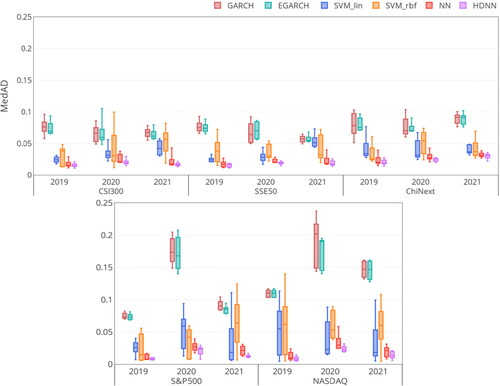
Figure 10. The MAPE metric of regressors on the five Stock Index datasets.
Source: The authors’ illustration.
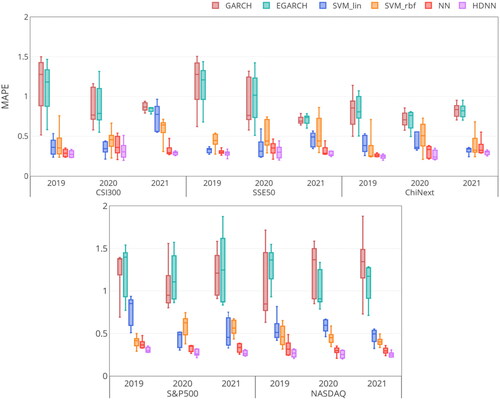
Figure 11. The R2 metric of regressors on the five Stock Index datasets.
Source: The authors’ illustration.
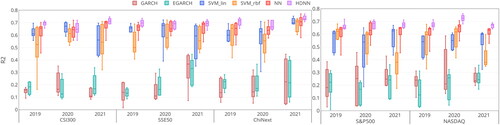
Table 4. Rank and statistic of the Friedman test on the CSI300 dataset.
Table 5. Rank and statistic of the Friedman test on the SSE50 dataset.
Table 6. Rank and statistic of the Friedman test on the ChiNext dataset.
Table 7. Rank and statistic of the Friedman test on the S&P 500 dataset.
Table 8. Rank and statistic of the Friedman test on the NASDAQ dataset.