
Figures & data
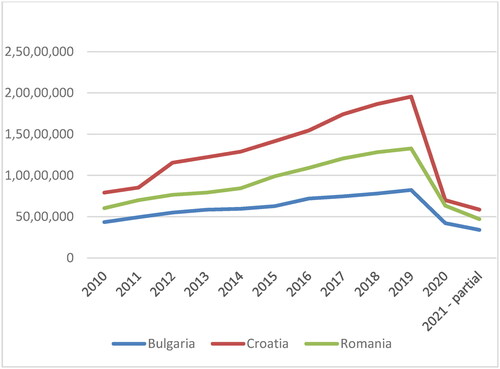
Figure 1. Annual arrivals in the period 2010–2021 (first semester).
Source: Author contribution based on statistical dataFootnote9
Table
Figure 2. Evolution of time series arrivals.
Source: Author Estimations based on SPSS 28
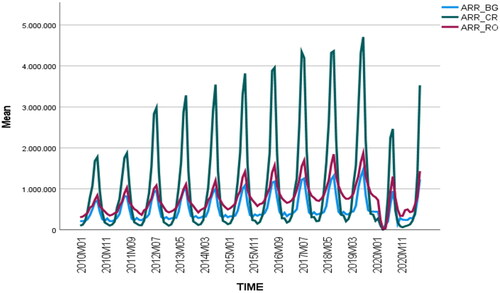
Table 1. Descriptive Statistics for the series arrivals.
Figure 3. Correlogram ACF and PACF.
Source: Author Estimations
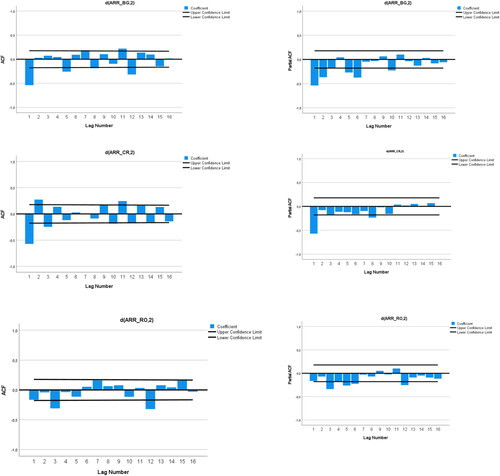
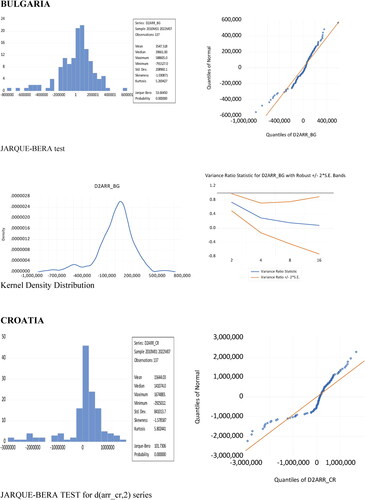
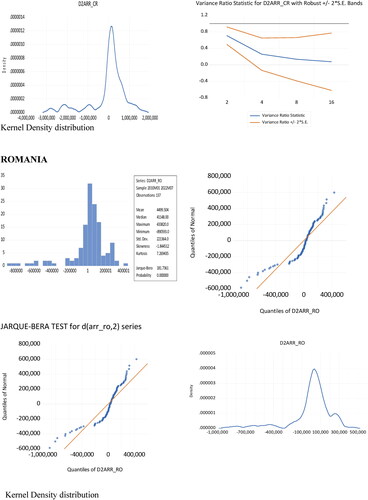
Figure 5. Trend for the stationary data series.
Source: Author Estimations
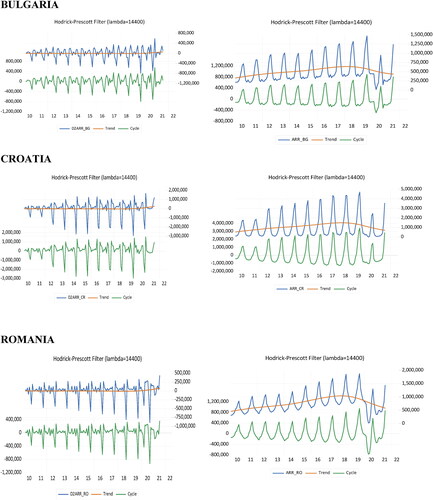
Figure 6. Seasonal averages for series d (arr_BG, 2), d (arr_CR, 2) and d (arr_RO, 2).
Source: Author Estimations based on EViews
Figure 7. STL Decomposition for the stationary data series.
Source: Author Estimations
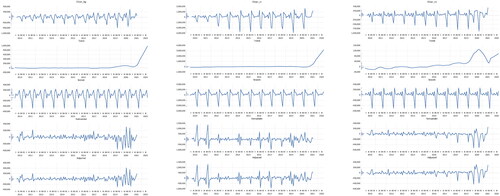
Figure 8. Forecast series for Bulgaria.
Source: Author Estimations
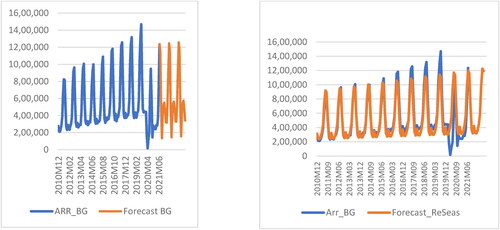
Figure 9. Forecast series for arr_CR and Forecast_Fourier_ReSeas_CR.
Source: Author Estimations
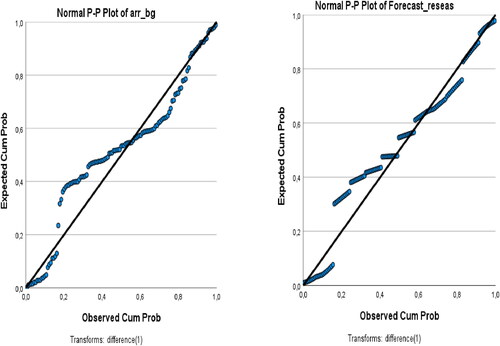
Figure 10. Forecast series for arr_RO and Forecast_Fourier_ReSeas.
Source: Author Estimations
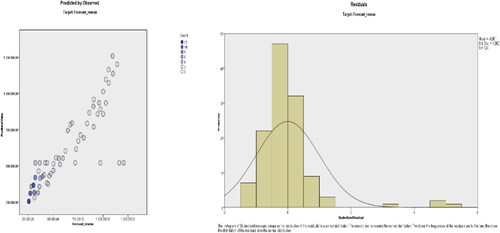
Figure 11. Normal probability plot for serie arr_BG and Forecast_ReSeas_BG.
Source: Author Estimations
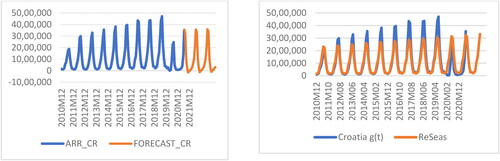
Figure 12. Normal probability plot for serie arr_CR and Forecast_ReSeas_CR.
Source: Author Estimations
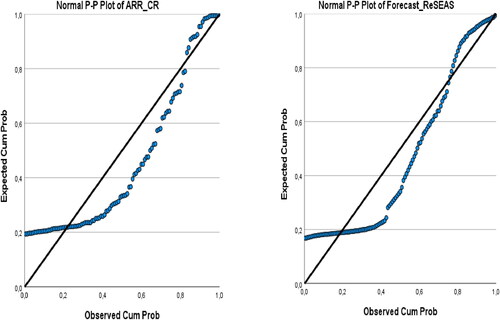
Figure 13. Normal probability plot for serie arr_RO and Forecast_ReSeas_RO.
Source: Author Estimations
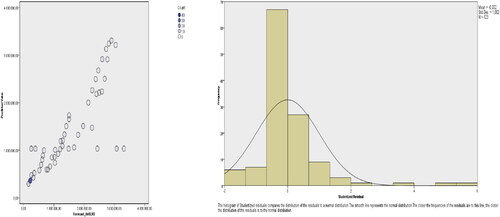
Figure 14. Predicted values Forecast_ReSeas_BG vs observed and distribution of residuals.
Source: Author Estimations
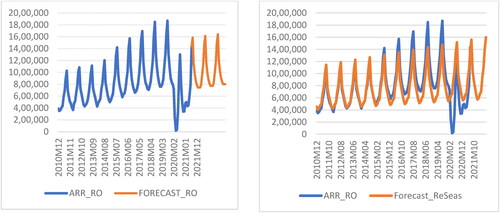
Figure 15. Predicted values Forecast_ReSeas_CR vs Observed and distribution of residuals.
Source: Author Estimations
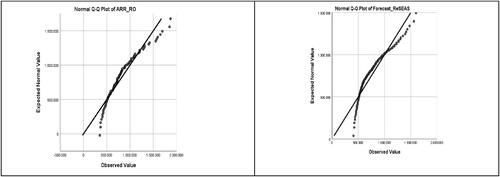
Figure 16. Predicted values Forecast_ReSeas_RO vs Observed and distribution of residuals.
Source: Author Estimations
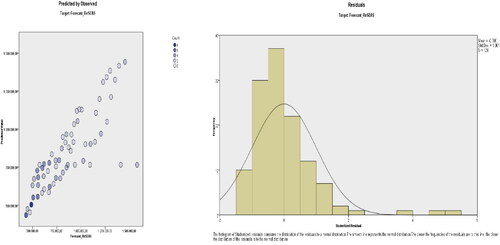
Table 2. Correlations for series arr_BG and Forecast_Fourier_ReSeas serie for Bulgaria.
Table 3. Correlations for series arr_BG and Forecast_Fourier_ReSeas serie for Bulgaria.
Table 4. Model Summary for Forecast_Fourier_ReSeas_BG.
Table 5. Correlations for series arr_CR and Fourier_Forecast_ReSeas serie for Croatia.
Table 6. Model Summary for Forecast_Fourier_ReSeas_CR.
Table 7. Model Summary for Forecast_Fourier_ReSeas_CR.
Table 8. Correlations for series arr_RO and Forecast_Fourier_ReSeas serie for Romania.
Table 9. Model Summary for Forecast_Fourier_ReSeas_RO.
Figure 17. Forecast Fourier.
Source: Author Estimations.
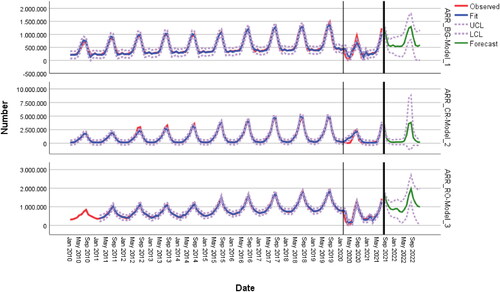
Table 10. Model Summary for Forecast_Fourier_ReSeas_RO.
Table 11. Forecast_Fourier_ReSeas.
Data availability statement
The data presented in this study are available on request from the corresponding author.