
Figures & data
Figure 1. Heihe River Basin (Arc GIS 10.3).
Source: Created by author.
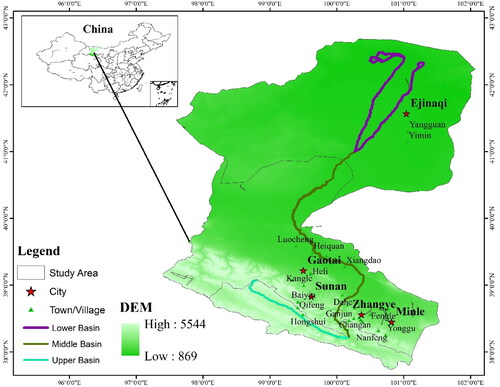
Figure 2. Graphical representation of survey.
Source: Created by author.
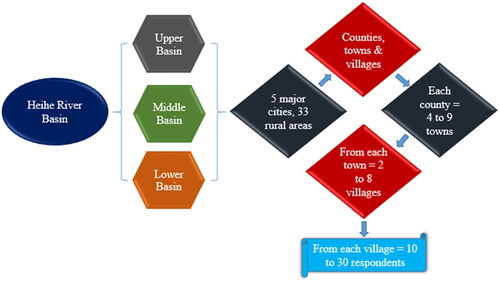
Table 1. Random parameter logit results for terrestrial attributes.
Table 2. Random parameter logit results for aquatic attributes.
Table 3. Mean willingness to pay results for terrestrial attributes.
Figure 3. Socioeconomic status of selected respondents.
Source: Created by author.
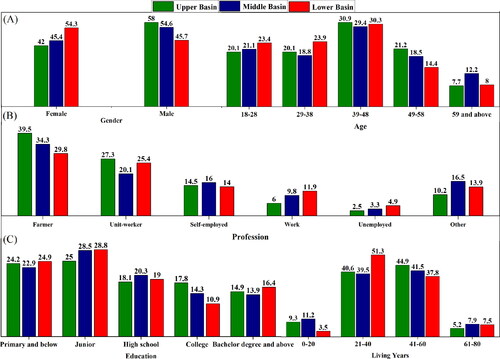
Figure 4. Depiction of mean, upper, and lower willingness to pay for terrestrial ecosystems in upper, middle and lower basins.
Source: Created by author.
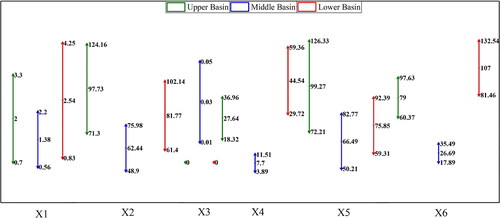
Figure 5. Depiction of mean, upper, and lower limits of willingness to pay for aquatic ecosystems in upper, middle and lower basins.
Source: Created by author.
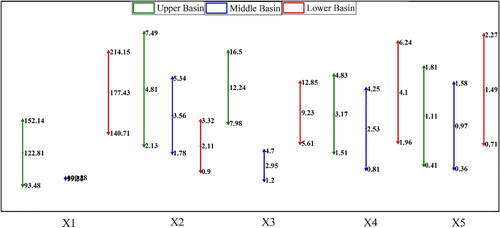
Table 4. Mean willingness to pay results for aquatic attributes.