1,203
Views
6
CrossRef citations to date
0
Altmetric
Crop Physiology

Hydathode function and changes in contents of elements in eddo exposed to zinc in hydroponic solution

, , &
Pages 423-433 | Received 28 Jan 2017, Accepted 01 Sep 2017, Published online: 05 Oct 2017

Figures & data

Figure 1. Photographs showing the effects of Zn treatments on (A) leaf blades and (B) roots of eddo.
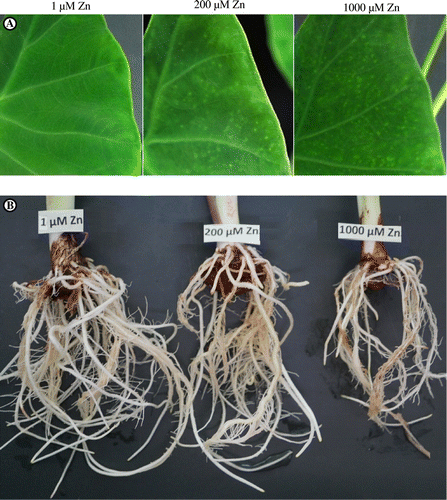
Figure 1. Photographs showing the effects of Zn treatments on (A) leaf blades and (B) roots of eddo.

Table 1. Effects of Zn treatments on leaf number, leaf blade length, petiole length, and root length in eddo.

Table 2. Effects of Zn treatments on the dry weights of the leaf blade, petiole, corm, and root in eddo.

Figure 2. Effects of Zn treatments on the contents of (A) Zn, (B) Mg, (C) P, (D) K, (E) Ca, (F) Mn, (G) Fe, and (H) Cu in leaf blades, petioles, corms, and roots of eddo.
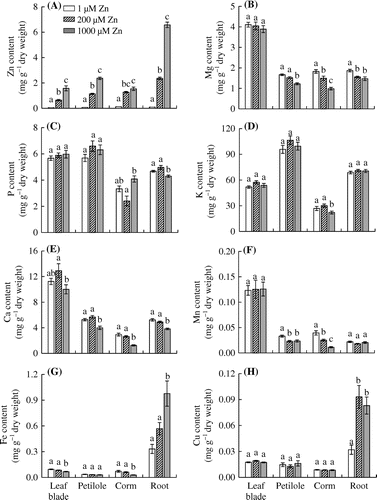
Notes: Vertical bars represent means ± SE (n = 12–16). Mean values with the same letters are not significantly different at 5% level (Tukey–Kramer’s test).
Figure 2. Effects of Zn treatments on the contents of (A) Zn, (B) Mg, (C) P, (D) K, (E) Ca, (F) Mn, (G) Fe, and (H) Cu in leaf blades, petioles, corms, and roots of eddo.

Figure 3. Effects of Zn treatments on the concentrations of (A) Zn, (B) Mg, (C) P, (D) K, (E) Ca, (F) Mn, (G) Fe, and (H) Cu in the guttation fluid and xylem sap of leaf blades in eddo.
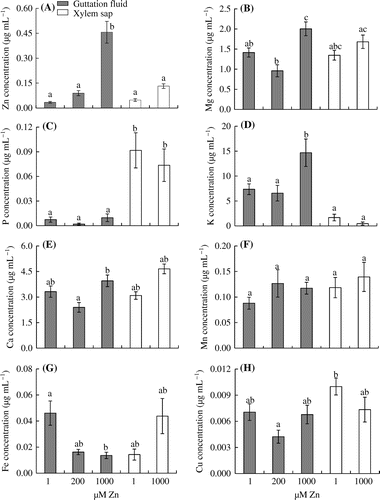
Notes: Vertical bars represent means ± SE (n = 12–14 in guttation fluid; n = 6 in xylem sap). Mean values with the same letters are not significantly different at 5% level (Tukey–Kramer’s test).
Figure 3. Effects of Zn treatments on the concentrations of (A) Zn, (B) Mg, (C) P, (D) K, (E) Ca, (F) Mn, (G) Fe, and (H) Cu in the guttation fluid and xylem sap of leaf blades in eddo.

Figure 4. Effects of Zn treatments on weight percentage of Zn relative to the major essential elements in leaf tips (hydathodes) and leaf blade centers of eddo.
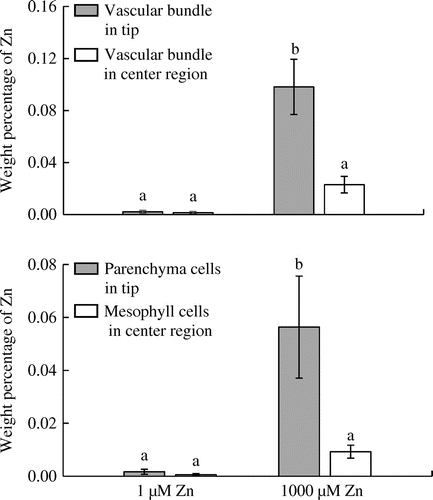
Notes: The percentage was measured on the transverse surfaces of the parenchyma cells and vascular bundles in the leaf tips (hydathodes), and the mesophyll cells and vascular bundles in the center of leaf blades under a scanning electron microscope with an EDS. Vertical bars represent means ± SE (n = 1014). Mean values with the same letters are not significantly different at 5% level (Tukey–Kramer’s test).
Figure 4. Effects of Zn treatments on weight percentage of Zn relative to the major essential elements in leaf tips (hydathodes) and leaf blade centers of eddo.

Figure 5. Effects of Zn treatments on the (A) volume and (B) Zn content of the guttation fluid in eddo.
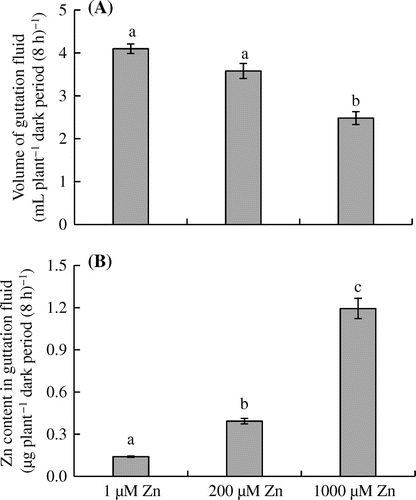
Notes: The Zn content in the guttation fluid was calculated by multiplying the volume of guttation fluid and the Zn concentration in the guttation fluid. Vertical bars represent means ± SE (n = 6). Mean values with the same letters are not significantly different at 5% level (Tukey’s test).
Figure 5. Effects of Zn treatments on the (A) volume and (B) Zn content of the guttation fluid in eddo.

Table 3. Effects of Zn treatments on the ratios of Zn content in the guttation fluid to that in leaf blades, shoots, and the whole plant of eddo.