Figures & data
Table 1. Salt tolerance of 7 Vigna crop species and 23 wild Vigna species.
Figure 1. Intra-specific diversity of salt tolerance indicated as change in percent of susceptible accessions within three wild Vigna species.
One hundred thirty accessions of V. vexillata, 50 accessions of V. luteola and 50 accessions of V. marina were used. Salt tolerance was examined under different concentrations of salt stress, i.e. 250 mM (First 4 weeks) to 350 mM NaCl (Next 4 weeks) for V. vexillata (▲), 300 mM to 400 mM NaCl for V. luteola (■), and 350 mM to 500 mM NaCl for V. marina (●).
Table 2. Comparison of dry-matter weight between the control and NaCl-treated plants.
Table 3. Dry-matter partitioning of leaf, stem and root as percent (%) in the control and NaCl-treated plants.
Figure 2. Comparison of the root between the control and NaCl-treated plants in each accession.
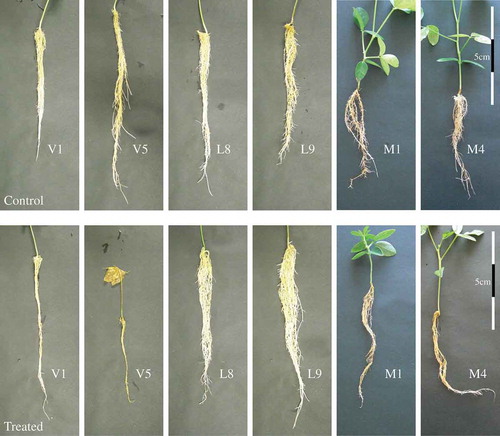
Figure 3. Comparison of growth parameters in the control and treated plants. (a) RGR. (b) NAR. (c) LAR. (d) SLA.
White and black bars indicate the control and NaCl-treated plants, respectively. Error bars indicate the standard deviation (n = 10). Numerals in the figure indicate the value of treated plant as percent of control. Asterisks indicate significant difference between the control and the treated plants at the 0.01 (**) probability level.
Figure 4. Relationship between LAR and NAR in the resistant accessions.
White and gray symbols indicate the control and NaCl-treated plants, respectively.
Figure 5. Effect of the NaCl treatment for physiological features of leaves. (a) Photosynthetic rate. (b) Transpiration rate. (c) Stomatal conductance. (d) SPAD value. White and gray bars indicate the control and NaCl-treated plants, respectively. Error bars indicate the standard deviation (Ph: n = 3 and SPAD value: n = 10). Numerals in the figure indicate percent of the control. Asterisks indicate significant difference between the control and the treated plants at the 0.01 (**) or 0.05 (*) probability level.
Figure 6. Na+ and K+ concentration and Na+/K+ ratio in the root, stem and leaf of the treated plants. Na+ concentration (a), K+ concentration (b), Na+/K+ ratio (c) and Ca2+ concentration (d).
Gray, light gray and white bars indicate root, stem and leaf, respectively. Error bars indicate the standard deviation. Different alphabets in the figures indicate significant difference between the root, stem and leaf in each accession at the 0.05 probability level.