Figures & data
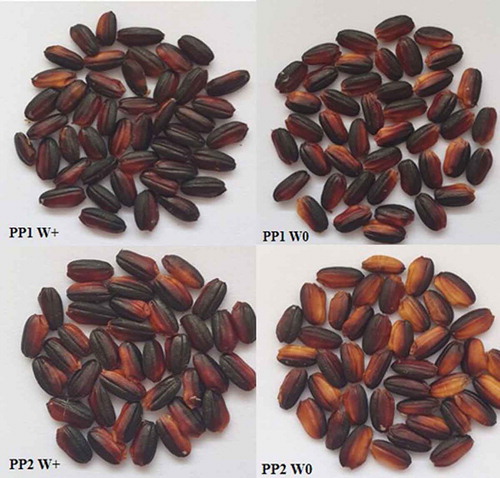
Table 1. Soil property at the site of the field experiment at Chiang Mai University in 2012 and 2017
Table 2. Description of eleven purple rice varieties grown in aerobic and wetland conditions at Chiang Mai, Thailand in 2012 and 2017
Figure 1. Characteristics of brown rice grain (unpolished) of the selected purple rice varieties obtained in this study
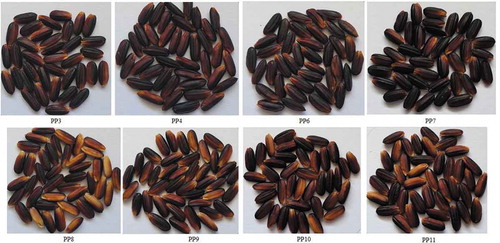
Figure 2. The experiment layout showing design and arrangement of main plot and subplot carried out in this study

Figure 3. Hours of sunshine, temperature (minimum/maximum), relative humidity, rainfall, during the cropping season in 2012 and 2017
Table 3. Significant effects of variety, water and year on the concentration of anthocyanin, Zn and Fe in the grain and yield of 11 purple rice varieties grown in aerobic and wetland conditions in 2012 and 2017
Table 4. Effects of water regimes (wetland, W+; aerobic, W0) on yield components of 11 purple rice varieties grown in 2 years
Figure 4. Effect of water regime (wetland, W+; aerobic, W0) on grain anthocyanin, Zn and Fe in brown rice and grain yield of 11 purple rice varieties (2 upland and 9 wetland ecotype) grown in two years (no yield data for PP2 in 2012) (Significant interaction effect of variety × water regime × year at P ≤ 0.05, *; P ≤ 0.001, ***). Each data is mean of 3 biological replications
Figure 5. Comparison of anthocyanin, Zn and Fe concentration in brown rice and grain yield of 11 purple rice varieties growing under aerobic compared with wetland condition in two years. Each data point is mean of 3 biological replications
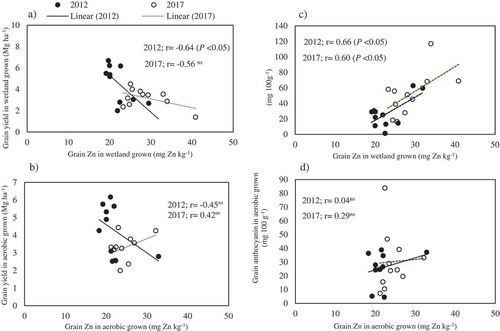
Table 5. Linear relationships between grain anthocyanin, Zn and Fe concentration and yield of 11 purple rice varieties grown in aerobic and wetland conditions in 2012 and 2017
Figure 6. Linear relationships between grain Zn, anthocyanin and yield of 11 purple rice varieties grown in aerobic and wetland condition in 2012 and 2017