Figures & data
Figure 1. Rice shoot biomass (a) and shoot P uptake (b) at around cumulative growing degree days of 672°C after transplanting as affected by different temperatures (Low T, high T, Elev. T) and P2O5 concentrations in the slurry (0%, 2.3%, and 4.4% for P0, P1, and P2, respectively). Data are shown as mean values of 0 h and 2 h dipping durations. Different letters indicate that mean values were significantly different among the treatments at 5% according to Tukey’s HSD test. Day/night temperature; 28°/20°C in Low T, 33°/25°C in High T, 36°/27°C in Elev. T.
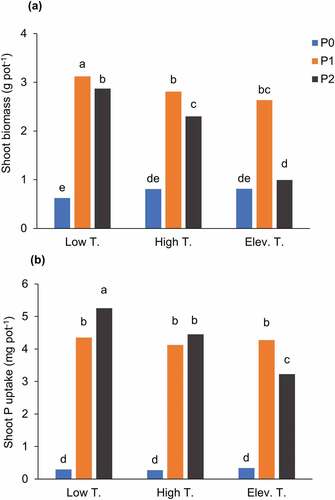
Table 1. Levels of significance in F statistics for the effect and interaction of temperature, P2O5 concentration in slurry, and dipping duration on the measured variables.
Figure 2. Percentages of withered portions of the 4th (a) and 3rd leaves (b) at six days after transplanting as affected by different temperatures (Low T, High T, Elev. T) and P2O5 concentrations in the slurry (0%, 2.3%, and 4.4% for P0, P1, and P2, respectively). Data are shown as mean values of 0 h and 2 h dipping durations. Different letters indicate that mean values were significantly different among the treatments at 5% according to Tukey’s HSD test. Day/night temperature; 28°/20°C in Low T, 33°/25°C in High T, 36°/27°C in Elev. T.
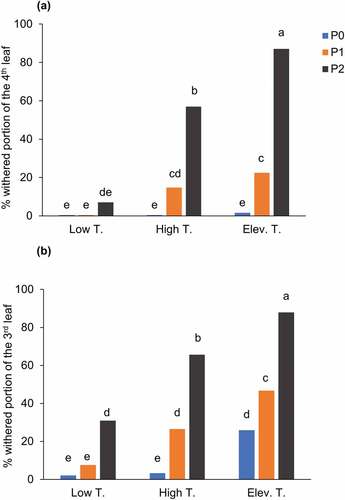
Figure 3. Number of tillers (a) and leaf age (b) at around cumulative growing degree days of 672°C after transplanting as affected by different temperatures (Low T, High T, Elev. T) and P2O5 concentrations in the slurry (0%, 2.3%, and 4.4% for P0, P1, and P2, respectively). Data are shown as mean values of 0 h and 2 h dipping durations. Different letters indicate that mean values were significantly different among the treatments at 5% according to Tukey’s HSD test. Day/night temperature; 28°/20°C in Low T, 33°/25°C in High T, 36°/27°C in Elev. T.
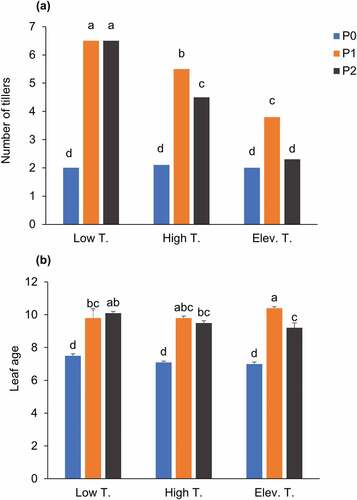
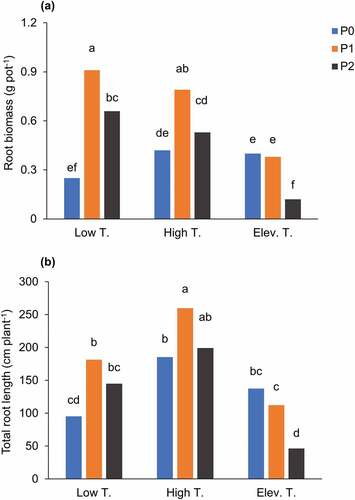
Figure 4. Root biomass (a) and total root length (b) at around cumulative growing degree days of 672°C after transplanting as affected by different temperatures (Low T, High T, Elev. T) and P2O5 concentrations in the slurry (0%, 2.3%, and 4.4% for P0, P1, and P2, respectively). Data are shown as mean values of 0 h and 2 h dipping durations. Different letters indicate that mean values were significantly different among the treatments at 5% according to Tukey’s HSD test. Day/night temperature; 28°/20°C in Low T, 33°/25°C in High T, 36°/27°C in Elev. T.
Data availability statement
The datasets generated during and/or analyzed during the current study are available from the corresponding author on reasonable request.