
Figures & data
Figure 1. Delayed and completed projects in KSA (Contracts and Projects, Technical report, 2015/2016).
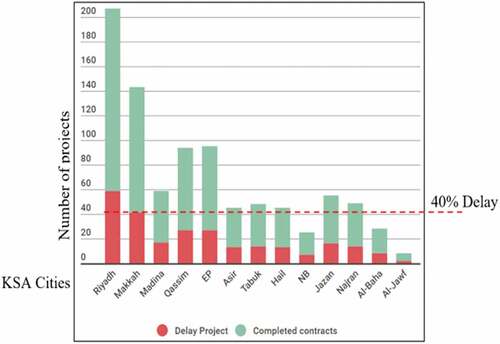
Figure 2. Pre-qualification diagram (Chee, Gary, and Patricia Citation2010).

Table 1. Summary of the researchers’ 21 contractor selection criteria.
Figure 3. The research methodology.
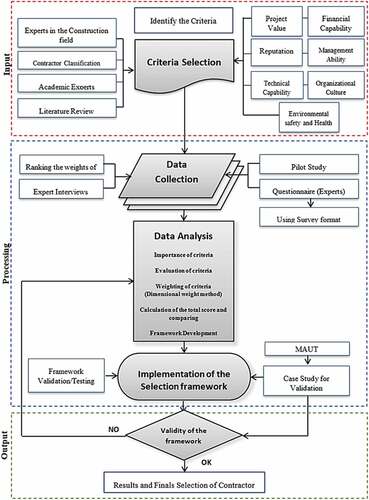
Figure 4. Process for obtaining the forty-criteria.

Figure 5. Smart techniques used the data analysis process.
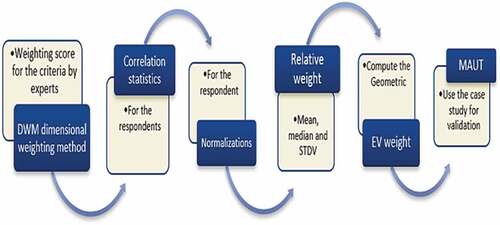
Figure 6. The enlarged methodology.
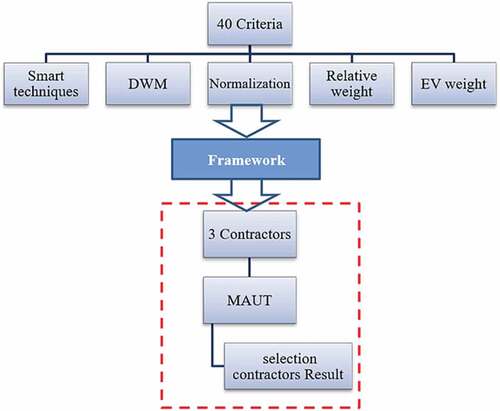
Table 2. Questionnaire survey for the weighting of the criteria on a 1–10 scale.
Table 3. The final selected criteria, incorporating input from construction field experts.
Figure 7. Participants’ response to the questionnaire.
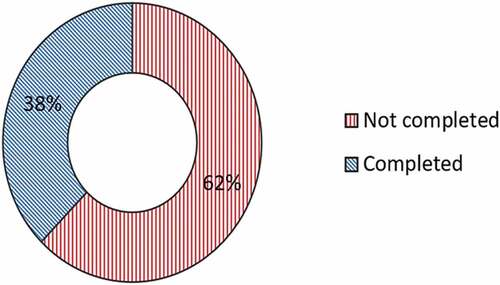
Figure 8. The positions of the respondents (78).
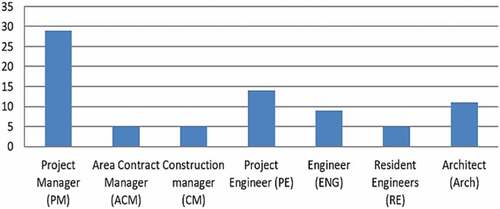
Figure 9. Respondents’ organizations.
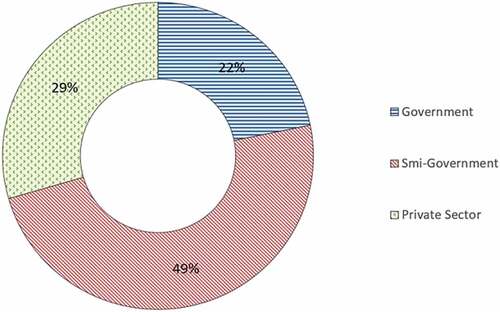
Table 4. The responses criteria analysis.
Table 5. Normalization of the criteria.
Figure 10. Normalization for criteria 1.
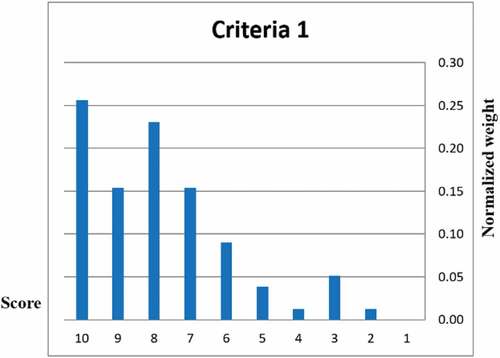
Figure 11. Normalization for criteria 2.
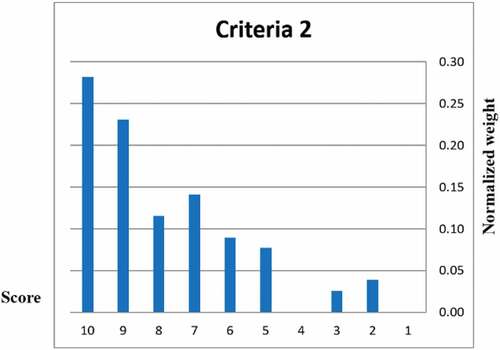
Figure 12. STDV scatter for all main categories.
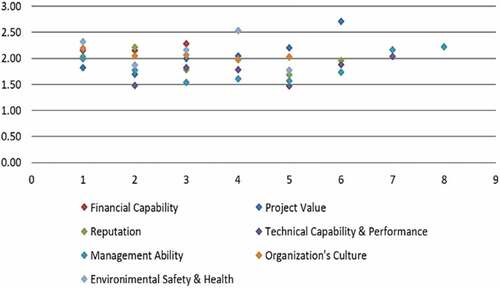
Table 6. Geometric and EV Weight Calculation.
Table 7. Ranked important criteria.
Figure 13. Contractors selection process and assessment flowchart.
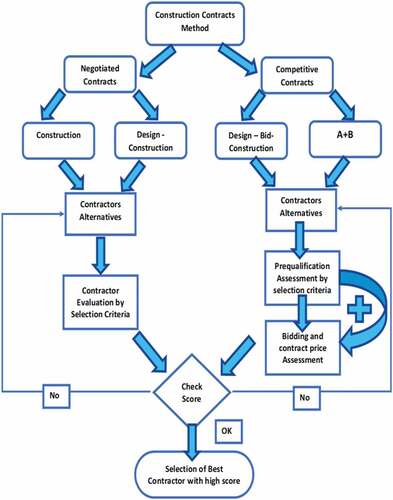
Figure 14. Chart of the case study steps.
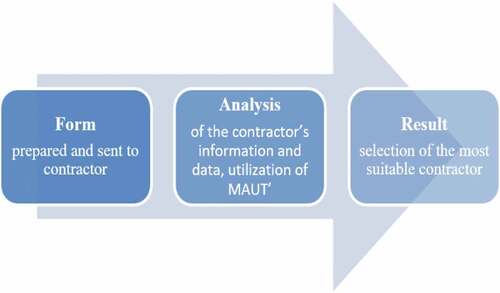
Figure 15. Utility value curve for criteria 2.
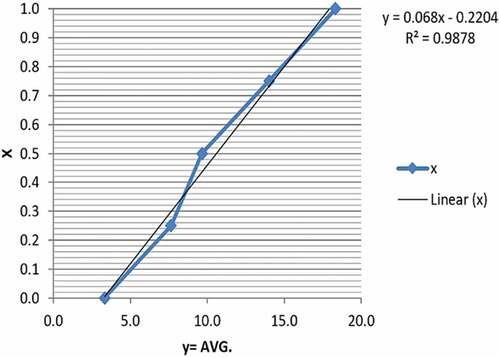
Table 8. The preference of pre-qualification and selection criteria 2.
Table 9. The contractor score.