
Figures & data
Table 1. Statistics of primary and secondary schools in Harbin city.
Figure 1. Research framework.
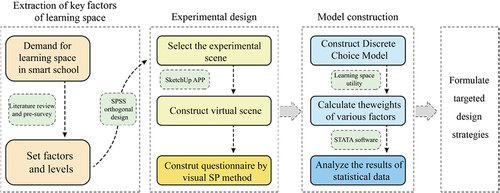
Table 2. Learning space factors and level settings of smart primary and secondary schools.
Table 3. Virtual learning space selection scenario model.
Table 4. Sample characteristic statistics. (n = 200).
Table 5. Statistics of the number of classroom models selected. (n = 3600).
Table 6. Descriptive statistics of classroom preference variables. (n = 200).
Table 7. Results of estimation of logit. (n = 200).
Figure 2. The comparison of variables’ coefficients.
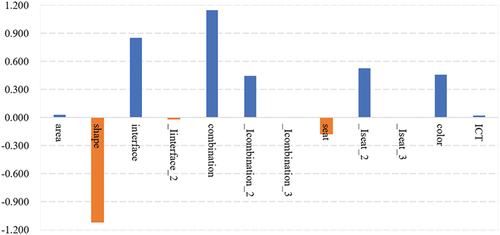
Table 8. Adjusted associations between gender and learning space preferences.
Table 9. Adjusted associations between sociodemographic characteristics and learning space preferences.