
Figures & data
Graph 1. Previously held positions by EA’s board members.
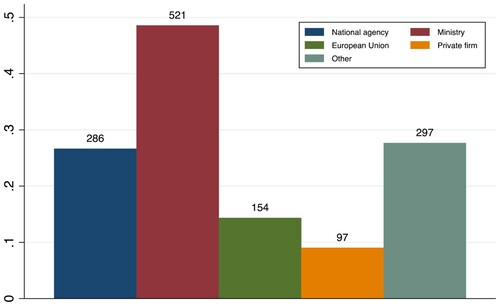
Table 1. Correlation coefficients board member backgrounds (N = 1073).
Graph 2. Sector of current occupation in addition to EU agency board membership.
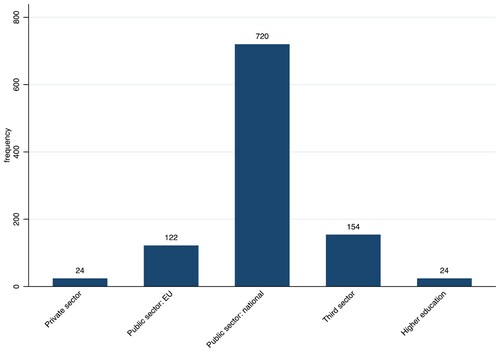
Table 2. Current working status controlled by current sector (percentages in brackets).
Table 3. Background of EU agencies board members by appointing authorities in 2015.
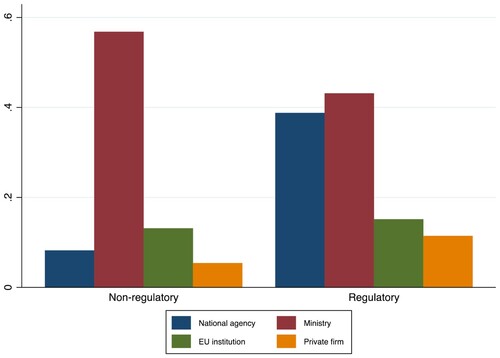
Graph 3. Positions held by board members EU agencies with a regulatory task.
Graph 4. Board members with various previous positions across regulatory EU agencies with various tasks.
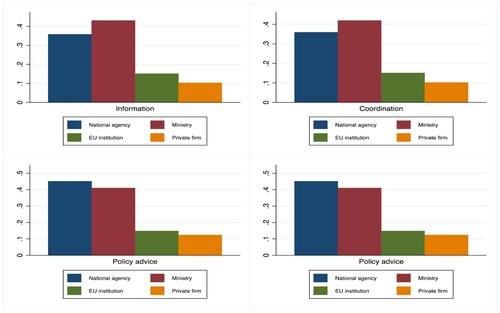
Table 4. Correlation coefficients board member background and EU agency tasks (N = 1073).
Table A1. Previous positions held by agency board members per EU agency.
Table A2. Tasks of regulatory and non-regulatory agencies.