
Figures & data
Table 1. Source information, by country.
Figure 1. Restrictive immigration opinions and asylum rates, by country (1980-2017).
Note: Immigration opinions have been standardised within each country. Higher values indicate more restrictive opinions.
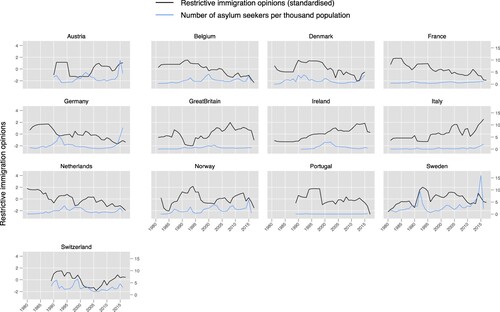
Table 2. Descriptive statistics across years, per country.
Table 3. Summarised factor results of immigration opinions.
Table 4. Public responsiveness for immigration.
Table 5. Policy responsiveness for immigration.
Supplemental material