Figures & data
Figure 1. Support for different types of solidarity in ten EU countries.
Notes: The figure reports the share of respondents agreeing with solidarities with 95% C. I., ordered by support for general redistributive solidarity and computed with post-stratification weights. The variables were recoded into binary variables to ease presentation. Mobility-related solidarities were coded 0 for answers ‘Somewhat disagree’ and ‘Strongly disagree’ and as 1 for ‘Somewhat agree’ and ‘Strongly agree’; redistribution as 0 (Against redistribution/Neutral) if answers ranged between 5 and 10 and as 1 if they ranged between 0 and 4 (In favour). Source: REScEU survey.
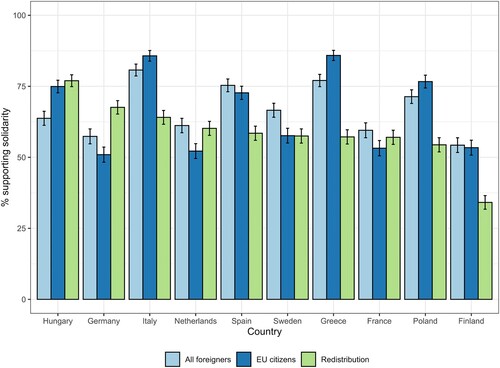
Table 1. Operationalization of individual transnationalism in EU10 countries.
Figure 2. Average transnationalism in the 10 EU countries surveyed.
Note: Country averages. Source: REScEU survey.
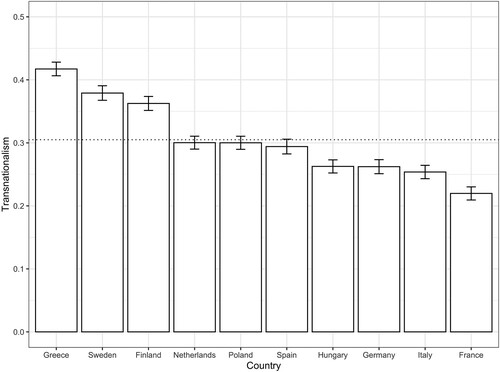
Figure 3. Support for solidarity across levels of transnationalism.
Notes: The figure reports average weighted percentages (markers) with 95% confidence intervals (lines). See the note in for details regarding the dichotomization of the three variables.
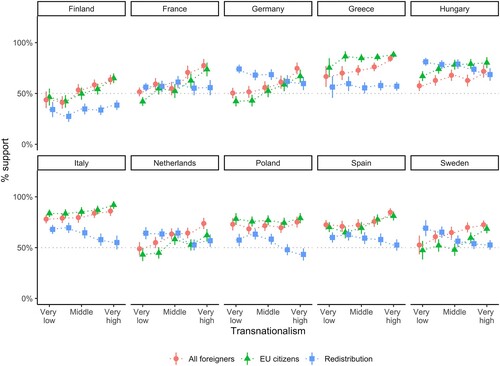
Figure 4. Standardized estimates for transnationalism and support for redistribution and mobility-related solidarities with correlated errors.
Note: Standardized coefficients from models in and Table H of the Online Appendix.
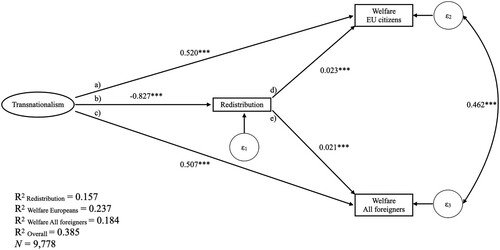
Table 2. Standardized coefficients of direct effects from the structural equation model.
Table 3. Standardized effects of transnationalism and redistribution on mobility solidarities with correlated residuals.
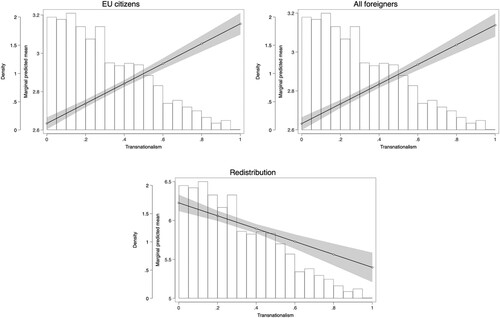
Figure 5. Change in the predicted probability of solidarities across levels of transnationalism.
Note: Predicted probabilities computed from models in and Table H of the Online Appendix with an underlying distribution of transnationalism.