Figures & data
Figure 1. A composition of the various ways Piaget, Hughes and Heddens use to name and categorize representations (van Bommel and Palmér Citation2017).
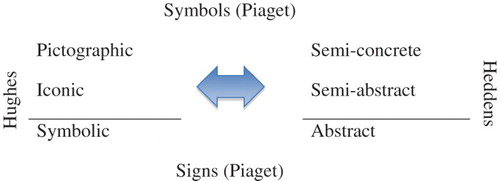
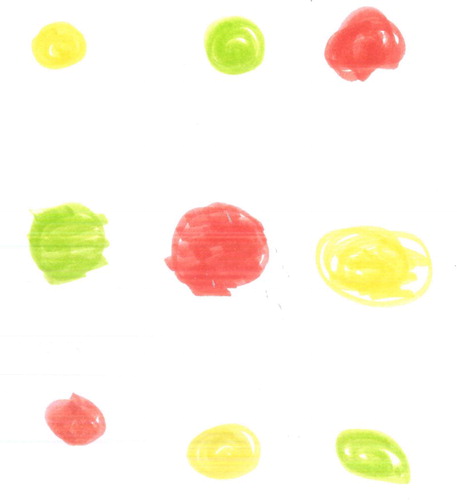
Figure 2. Examples of different representations, the first pictographic, the second iconic and the third both pictographic and iconic.
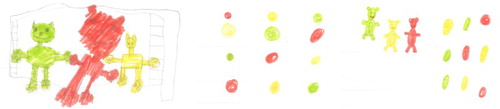
Table 1. Categorization of documentations based on representation and systematization.
Figure 3. Examples of documentations with six duplications: the left with a trial-and-error approach, the right with an odometer approach where one item is held constant while the others are varied systematically.
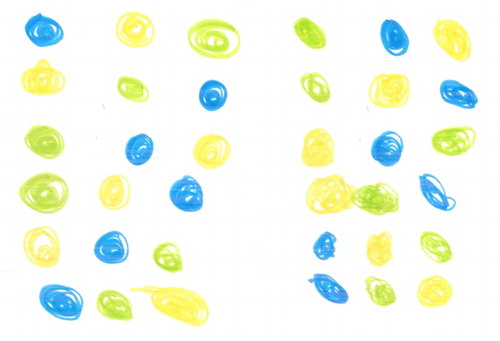
Figure 4. Example of documentation with iconic representation replacing the toy bears with hearts.
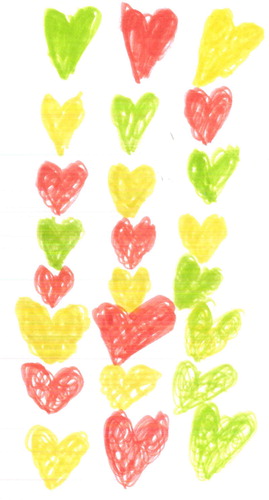
Figure 5. Example of documentation with duplications.
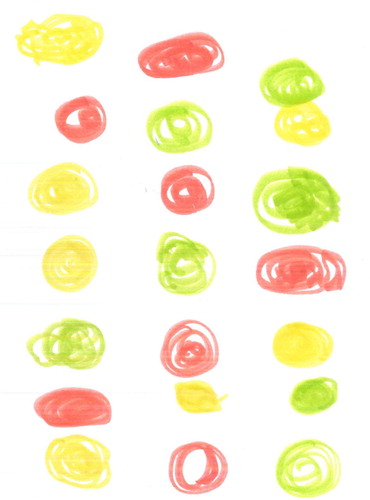
Figure 6. Example of documentation ‘odometer – not all solutions’ with each bear sitting one time at each place.