Figures & data
Figure 1. Some play elements designed by Aldo van Eyck.
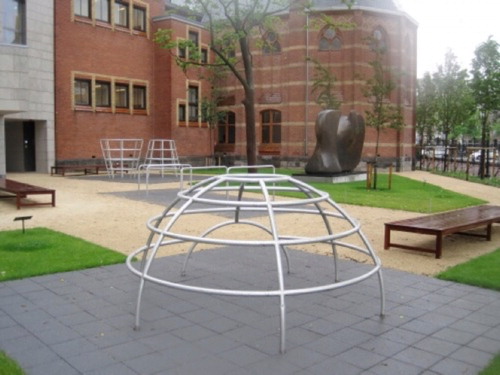
Figure 2. A parkour playground at a schoolyard.
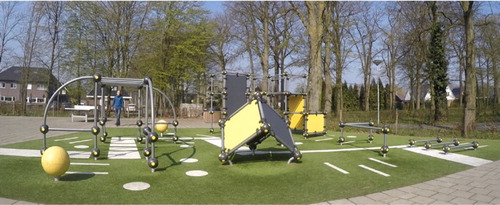
Figure 3. Slides with the fifteen play elements that were presented to the participants. The name of the play elements was not presented to the participants.
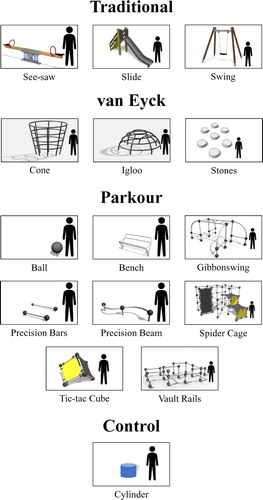
Figure 4. The median and the 25th and 75th percentiles of the number of action categories for each play element. The top of the bars indicates the 75th percentiles, the bottom of the bars indicates the 25th percentiles, and the thick line in the bars indicates the medians. Significant differences are mentioned below the figure.
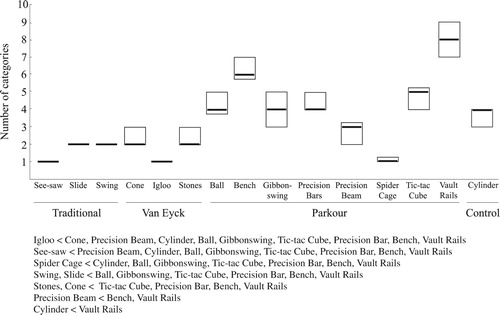
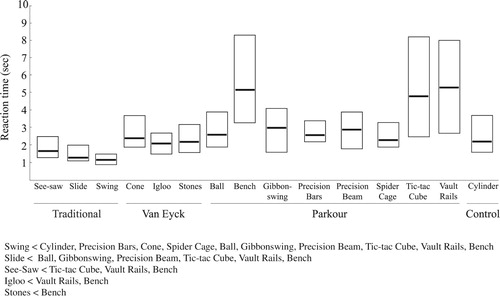
Figure 5. The median and the 25th and 75th percentiles of the reaction time for each play element. The top of the bars indicates the 75th percentiles, the bottom of the bars indicates the 25th percentiles, and the thick line in the bars indicates the medians. Significant differences are mentioned below the figure.