
Figures & data
Figure 1. A schematic representation of the VBN model. (Adapted from Stern Citation2000, 412).
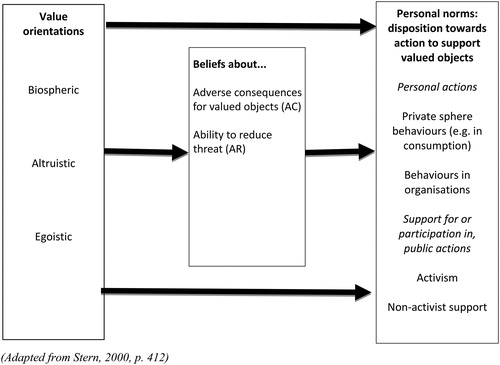
Table 1. Factors extracted on value orientations.
Table 2. Factors extracted on beliefs.
Table 3. Factors extracted on personal norms.
Table 4. Sample characteristics.
Table 5. Individuals’ change in value orientation between T1 and T2.
Figure 2. Distribution of value orientations at T1.
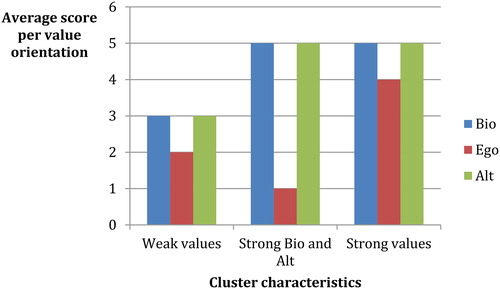
Table 6. Change in beliefs about the efficacy of actions between T1 and T2.
Table 7. Change in norms.
Table 8. Factors associated at T1 with normsTable Footnote† (dispositions towards personal and policy action on climate change).
Table 9. Factors associated with a change in norms (dispositions towards personal and policy action on climate change).