Figures & data
Figure 1. Map of 12-county greater San Francisco Bay Area.
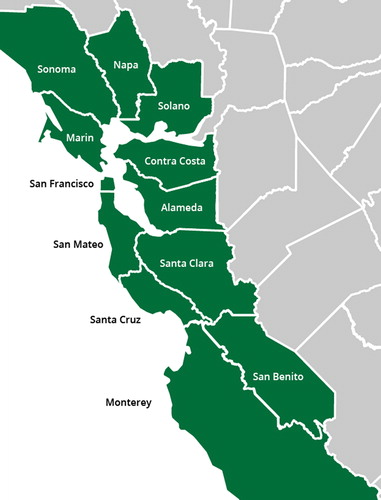
Table 1. Summary of data collection methods.
Table 2. Responses to network survey.
Figure 2. Combined whole-network plot of 950 organizations. Nodes on network graph represent organizations that were surveyed (large nodes) or identified by survey respondents (small nodes).
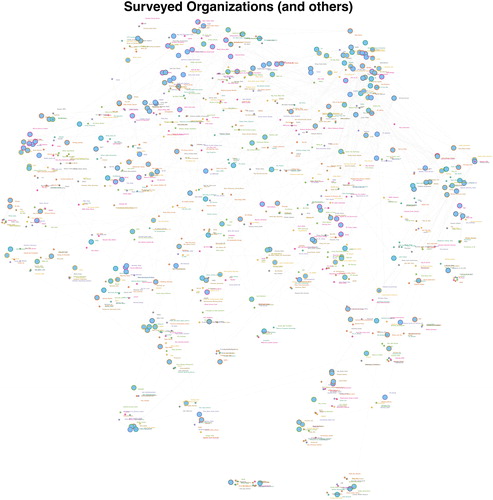
Table 3. Primary fields of work among respondent organizations.
Figure 3. Primary fields of work, as indicated by node color. Nodes on network graph represent organizations that were surveyed (large nodes) or identified by survey respondents (small nodes).
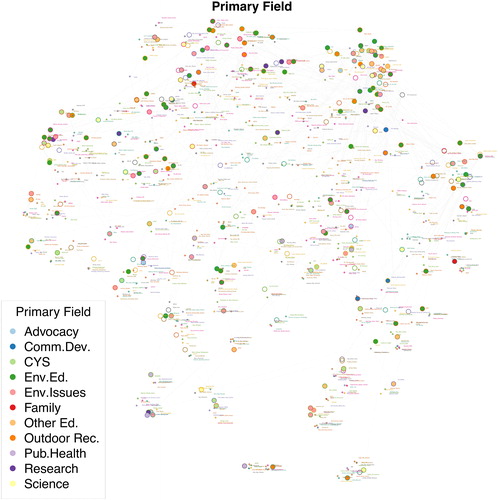
Figure 4. Geographic location (Bay Area County where organization’s home/main office is located), as indicated by node color. Only surveyed organizations were asked this information and are represented.
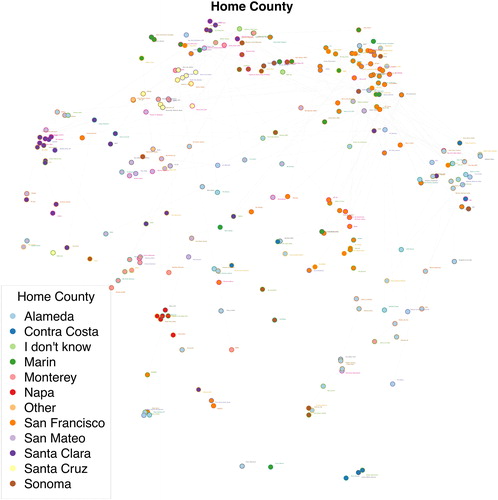
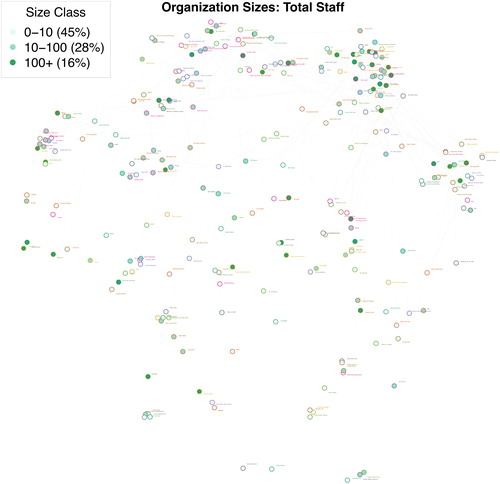
Figure 5. Organization size (total number of staff members), as indicated by node shading. Only surveyed organizations wereasked this information and are represented.