Figures & data
Figure 1. Stages of the systematic review process.
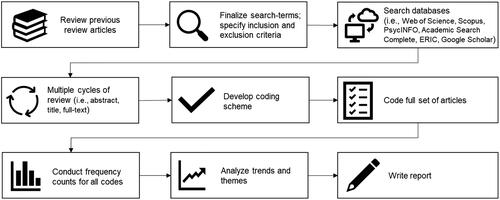
Figure 2. Systematic review process: identification, screening, and eligibility assessment.
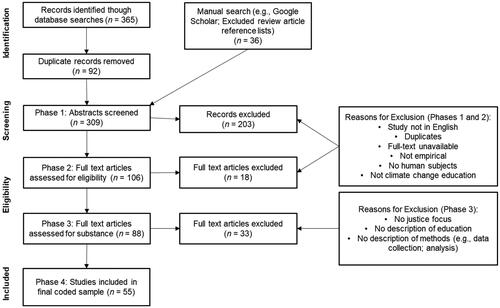
Figure 3. Number of publications over time.
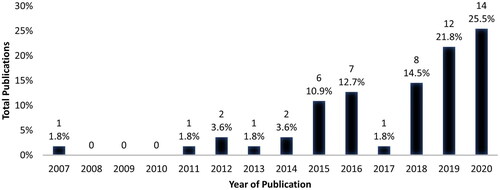
Figure 4. CiteScore over time.
Note. Diamonds represent articles published in journals with a CiteScore. Dashes indicate articles published in journals with no CiteScore.
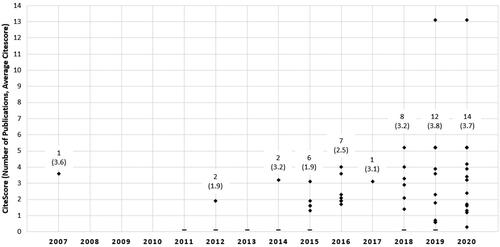
Figure 5. Publications by journal discipline category.
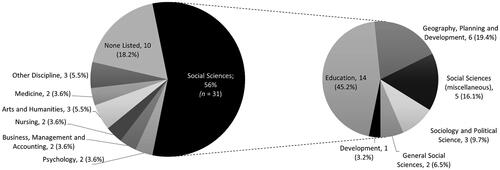
Figure 6. Map of author institutional affiliations.
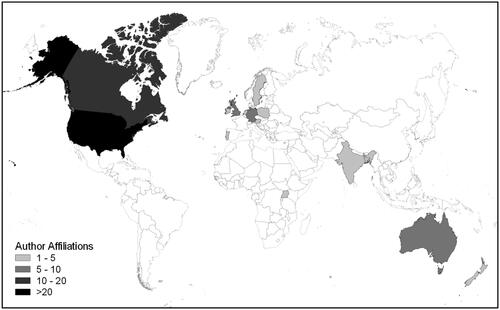
Table 1. Geographic location of author institutional affiliations.
Figure 7. Word cloud of journal article keywords.
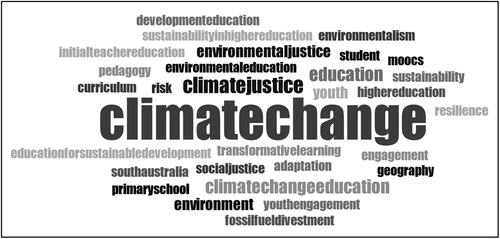
Figure 8. Prevalence of justice framings across articles.
Note. The (Socio-)Ecological category included eco-justice, eco-social, socio-ecological, socio-environmental, and earth justice framings.
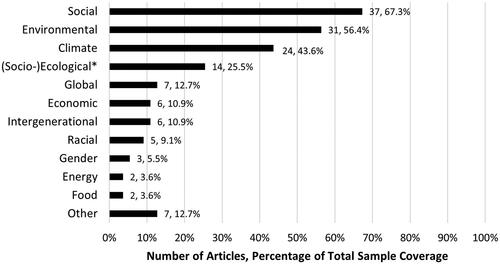
Figure 9. Centrality of justice frameworks.
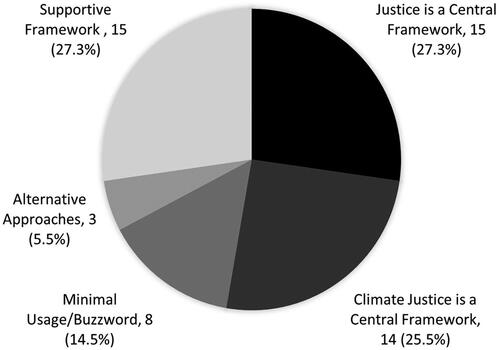
Figure 10. Research design by major methodology.
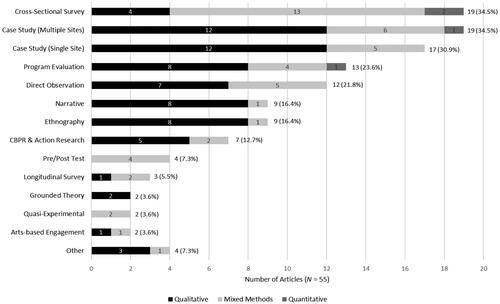
Figure 11. Data type by major methodology.
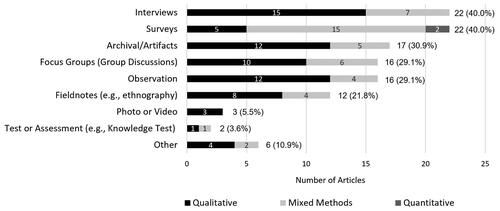
Figure 12. Geographic location of educational programming and data collection across studies.
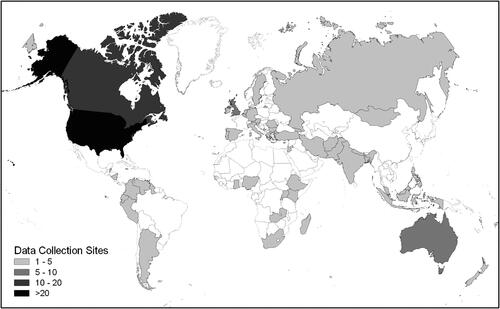
Table 2. Data collection countries across articles.
Table 3. Characteristics of education.
Table 4. Conceptualizing learning across studies.
Table 5. Characteristics of action across articles.
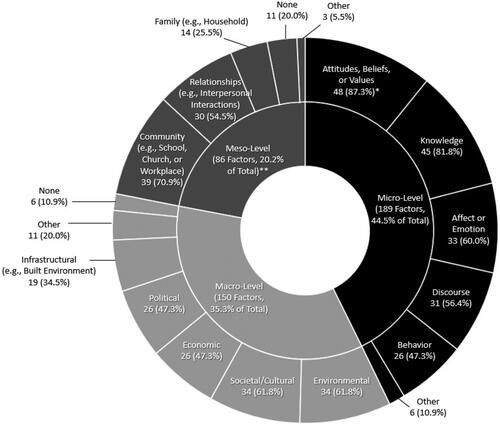
Figure 13. Factors investigated across ecological levels.
Note. * = Number of Articles (% of Total Articles; Sample Coverage); ** = Number of Factors Investigated at this Scale Across Articles (% of Total Factors Investigated; Relative Proportions Across Sample).