Figures & data
Figure 1. Exemplary trial (from left to right): The fixation cross, optional forward mask (in subliminal trials only), cue (direction word: right), optional backward mask (in subliminal trials only), and the target display are shown. The target is a colour target (green number at the right position). The preceding word right validly cued its location. Stimuli are not drawn to scale. The arrow depicts the flow of time. ISI: Inter-Stimulus Interval.
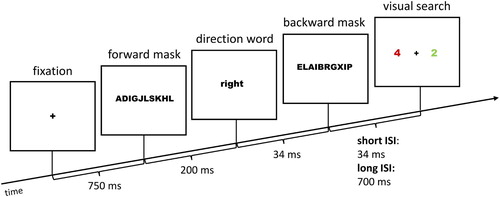
Figure 2. (A) Event-related potentials (ERPs) elicited by masked cues at electrode sites PO7 (left panel) and PO8 (right panel), depending on the identity of the cue word (dashed line: left, solid line: right). (B) ERPs elicited by unmasked cues at electrode sites PO7 (left panel) and PO8 (right panel), depending on the identity of the cue word (dashed line: left, solid line: right). For unmasked cues, the early directing-attention negativity (EDAN; not significant) can be seen between 250 and 450 ms (PO7) and the significant late directing-attention positivity (LDAP) between 500 ms and 800 ms (PO8).
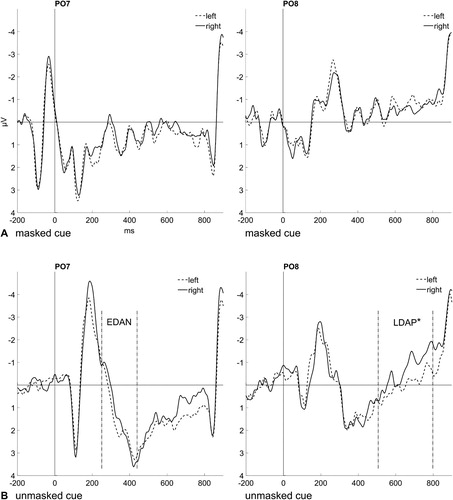
Figure 3. (A) Event-related potentials (ERPs) elicited by masked cues at electrode sites FC5 (left panel) and FC6 (right panel), depending on the identity of the cue word (dashed line: left, solid line: right). (B) ERPs elicited by unmasked cues at electrode sites FC5 (left panel) and FC6 (right panel), depending on the identity of the cue word (dashed line: left, solid line: right). The anterior directing-attention negativity (ADAN; not significant) can be seen between 300 and 500 ms for unmasked cues only (FC5).
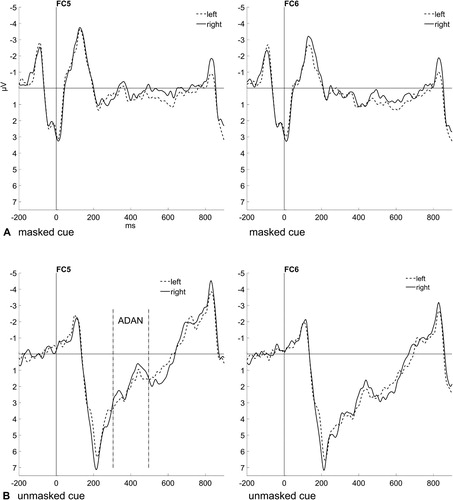
Figure 4. (A) Event-related potentials (ERPs) elicited by colour targets after valid masked cues (top left panel) and invalid masked cues (top right panel). (B) ERPs elicited by colour targets after valid unmasked cues (bottom left panel) and ERPs elicited by location targets after valid unmasked cues (bottom right panel). The ERPs are shown at the electrode sites PO7 and PO8 contralateral (dashed lines) and ipsilateral (solid lines) to the target position. The N2pc can be seen between 200 und 300 ms after target onset and is significant, except for location targets (bottom right panel).
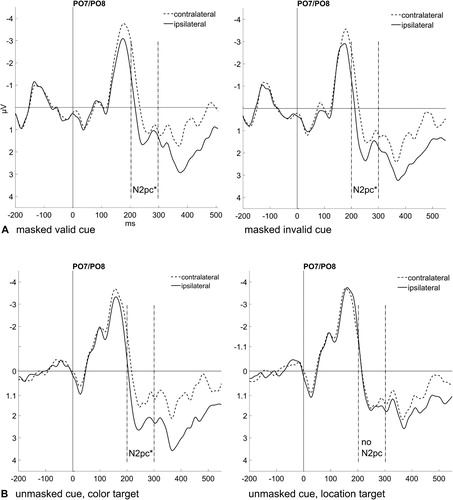
Figure 5. Distribution of the individual d’-values of all 14 participants in the masked condition of Experiment 1.
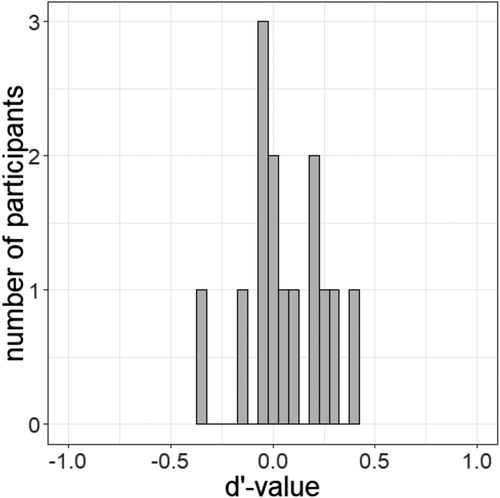
Figure 6. Mean reaction times (RTs) in trials with masked cue words (left panel) and unmasked cue words (right panel). Left panel: Dashed lines represent valid trials, solid lines invalid trials. Right panel: Dashed lines represent trials with location targets, solid lines trials with colour targets. The blue lines show slow reaction times after median split, the red lines fast reaction times after median split and the green lines the average of the complete data. Error bars represent average SEs.
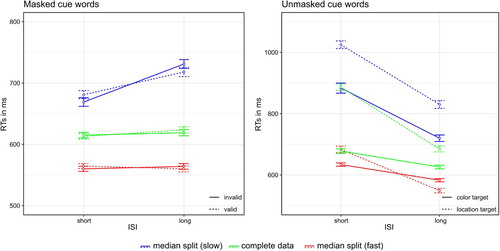
Figure 7. Exemplary trials of Experiment 2, Block 1 (from left to right): The fixation cross, forward mask, cue/prime word (right), backward mask, the optional longer ISI condition filled with a dummy word (upper trial), and two different versions of the target display are shown. The upper trial shows a target display of the visual search task. The target is the green bar at the upper right position (its location was validly cued by the preceding word right). The lower trial shows a target of the target-word discrimination task (target word left, incongruent to the preceding cue/prime word right). Stimuli are not drawn to scale. The arrow depicts the flow of time.
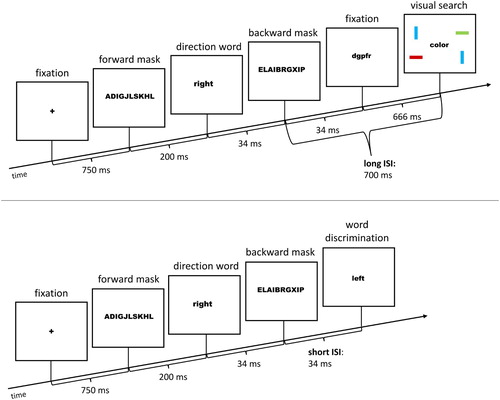
Figure 8. (A) Grand average of event-related potentials (ERPs) elicited at fronto-central electrode sites (F1, C1, CP1, P1, Fz, Cz, CPz, Pz, F2, C2, CP2, P2) in the target-word discrimination task depending on whether a trial is congruent (dashed line) or incongruent (solid line). Data is averaged across the steps of the nonsignificant variables Identity of the cue/prime word and Block. (B) Scalp distribution map showing the difference in brain activity between congruent and incongruent trials (congruent minus incongruent).
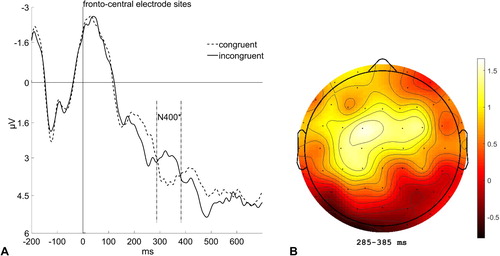
Figure 9. (A) This figure shows event-related potentials (ERPs) elicited by the centrally presented masked cue word, depending on its identity: cue word left (dashed line), cue word right (solid line). Electrodes of the left hemisphere are depicted on the left (upper panel: FC5; lower panel: PO7). Electrodes of the right hemisphere are depicted on the right (upper panel: FC6; lower panel: PO8). Data are averaged across steps of the nonsignificant variable Block. The anterior directing-attention negativity (ADAN) can be seen between 300 and 500 ms (FC6), the early directing-attention negativity (EDAN) between 250 and 450 ms (PO7) and the late attention-directing positivity (LDAP) between 500 and 800 ms (PO8). (B) Scalp distribution maps showing the difference between brain activity for the cue/prime word left and right at selected time points.
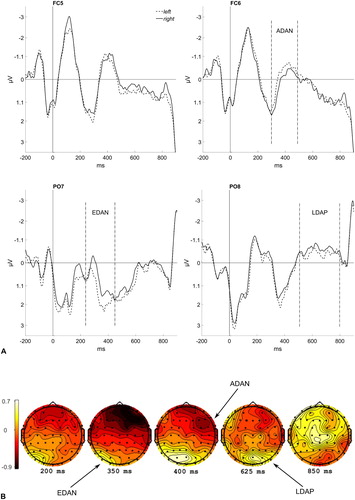
Figure 10. (A) Event-related potentials (ERPs) elicited in the visual search task in valid trials (left panel) and invalid trials (right panel) at the electrode sites PO7 and PO8 contralateral (dashed lines) and ipsilateral (solid lines) to the target bar. Data are averaged across the steps of the nonsignificant variables (ISI and Block). The N2pc can be seen between 200 und 300 ms after target onset. (B) Scalp distribution map showing the difference in brain activity for a target at the left versus right side.
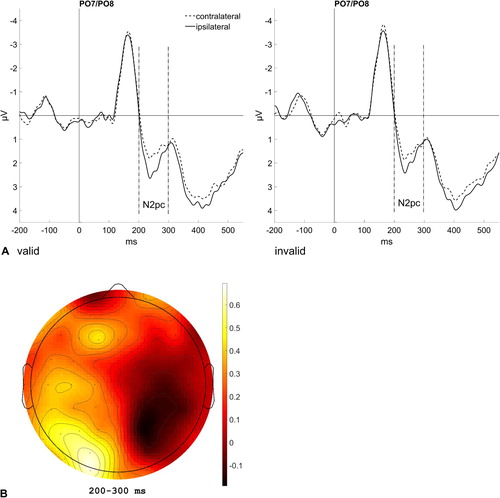
Figure 11. Distribution of the individual d’-values of all 20 participants of Experiment 2.
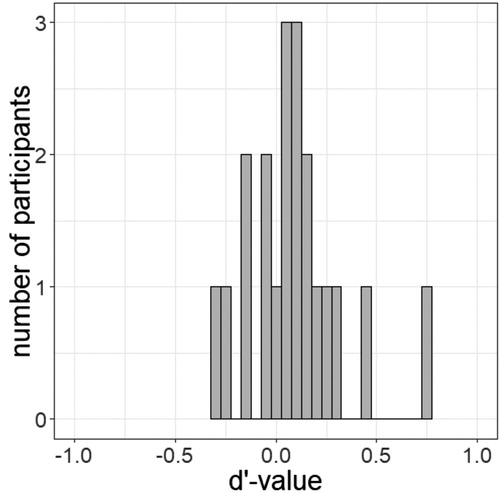
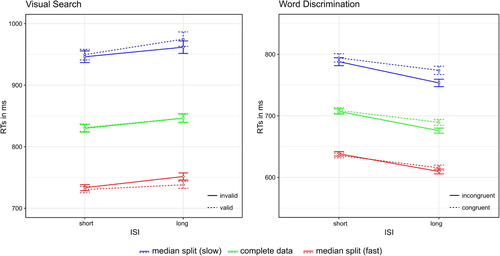
Figure 12. Mean reaction times (RTs) to visual search targets (left panel) and word discrimination targets (right panel). Dashed lines represent valid/congruent trials, solid lines invalid/incongruent trials. The blue lines show slow reaction times after median split, the red lines fast reaction times after median split and the green lines the average of the complete data. Error bars represent average SEs.