Figures & data
Table 1 Fluid intake, body weight, absolute, and relative organ weights in rats exposed to 2,5-HD for 21 consecutive days
Figure 1 SOD, CAT, GST, and GPx activities in testes and sperm following 21 consecutive days of 2,5-HD treatment in rats. Each bar represents mean ± SD of eight rats. aP < 0.05 vs. Control; bP < 0.05 vs. 0.25% 2,5-HD.
Figure 2 GSH, H2O2 production, and lipid peroxidation levels in testes and sperm following 21 consecutive days of 2,5-HD treatment in rats. Each bar represents mean ± SD of eight rats. aP < 0.05 vs. Control; bP < 0.05 vs. 0.25% 2,5-HD, cP < 0.05 vs. 0.5% 2,5-HD.
Figure 3 Epididymal sperm number, motility, and viability in experimental rats following 21 consecutive days of 2,5-HD treatment in rats. Each bar represents mean ± SD of eight rats. aP < 0.05 vs. Control; bP < 0.05 vs. 0.25% 2,5-HD, cP < 0.05 vs. 0.5% 2,5-HD.
Figure 4 Specific (i.e. head, mid-piece, and tail) and total sperm morphological abnormalities in experimental rats following 21 consecutive days of 2,5-HD treatment in rats. Each bar represents mean ± SD of eight rats. aP < 0.05 vs. Control.
Figure 5 Histopathology of testes from control and 2,5-HD-treated rats. Representative photomicrographs of testes from control (A) and 0.25% 2,5-HD (B) showed normal morphology. Treatment-related lesions such as vacuolization (red arrow) and marked degeneration of the seminiferous tubules (black arrow) were observed in the testes of 0.5% 2,5-HD (C) and 1% 2,5-HD-treated rats (D).
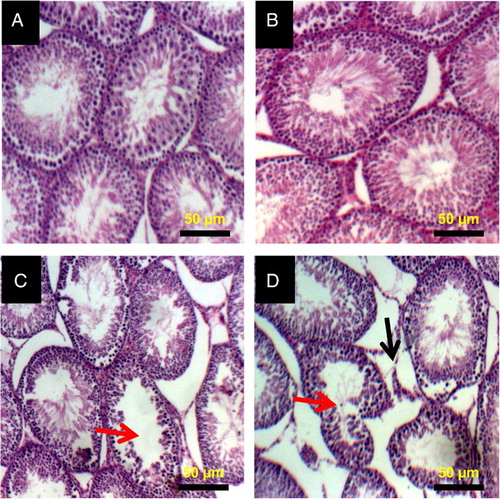
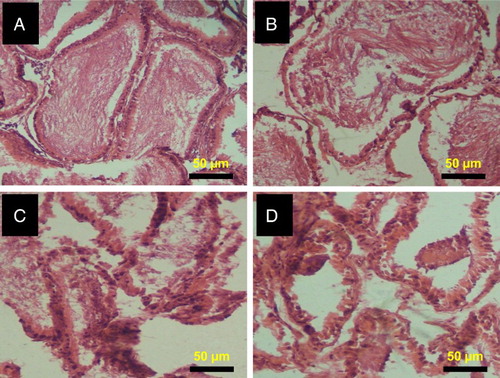
Figure 6 Histopathology of epididymis from control and 2,5-HD-treated rats. Representative photomicrographs of epididymis from control (A) and 0.25% 2,5-HD (B) showed normal morphology. Epididymis from 0.5% 2,5-HD (C) and 1% 2,5-HD (D) groups showed progressive degeneration of epididymis characterized with severe erosion of the epididymal lining and reduced epithelia layer integrity.