Figures & data
Figure 1 Kaplan–Meier survival curve of all in vivo studies involving the administration of the solvent (sodium bicarbonate, SB, 2.3 or 4.6 ml/kg, i.v.) or rutin (Ru, 11.5 or 46 mg/kg, i.v.), i.e. controls, and their combination with ISO (100 mg/kg, s.c.). The statistical analysis was performed using the log-rank test.
![Figure 1 Kaplan–Meier survival curve of all in vivo studies involving the administration of the solvent (sodium bicarbonate, SB, 2.3 or 4.6 ml/kg, i.v.) or rutin (Ru, 11.5 or 46 mg/kg, i.v.), i.e. controls, and their combination with ISO (100 mg/kg, s.c.). The statistical analysis was performed using the log-rank test.](/cms/asset/92a728f4-ddda-4c20-b953-c02be060f1f6/yrer_a_1159817_f0001_b.gif)
Figure 2 Serum concentration of cTnT after 2-hour haemodynamic study involving the administration of the solvent (sodium bicarbonate, SB, 2.3 or 4.6 ml/kg, i.v.) or rutin (Ru, 11.5 or 46 mg/kg, i.v.), i.e. controls, and their combination with ISO (100 mg/kg, s.c.) including the comparison with saline (S, 4.6 ml/kg, i.v.). Data are expressed as means ± SEM. The statistical analysis was performed using one-way ANOVA followed by Tukey's multiple comparison test. Statistical significance: c vs. the corresponding control group at P < 0.001. Because of high mortality in the group Ru46+ISO, its data were not included in the statistical analysis.
![Figure 2 Serum concentration of cTnT after 2-hour haemodynamic study involving the administration of the solvent (sodium bicarbonate, SB, 2.3 or 4.6 ml/kg, i.v.) or rutin (Ru, 11.5 or 46 mg/kg, i.v.), i.e. controls, and their combination with ISO (100 mg/kg, s.c.) including the comparison with saline (S, 4.6 ml/kg, i.v.). Data are expressed as means ± SEM. The statistical analysis was performed using one-way ANOVA followed by Tukey's multiple comparison test. Statistical significance: c vs. the corresponding control group at P < 0.001. Because of high mortality in the group Ru46+ISO, its data were not included in the statistical analysis.](/cms/asset/5d5a82ad-03e6-4796-b45a-d8f9b1a318e2/yrer_a_1159817_f0002_b.gif)
Figure 3 Overview of histological findings in endocardium and myocardium after 2-hour haemodynamic study. Staining: haematoxylin–eosin and Goldner's trichrome green. Representatives of control groups (A; rutin 11.5 mg/kg, i.v.) and ISO groups (100 mg/kg, s.c.) involving a premedication with rutin (B; 11.5 mg/kg, i.v.) or sodium bicarbonate (C; the solvent, 2.3 ml/kg, i.v.). In contrast to normal structural architecture in the control groups (A), marked alterations were found after the administration of ISO (B). Although rutin partly ameliorated histopathological changes, local capillary hyperaemia, mild interstitial oedema with dilation or swelling of cardiomyocytes, and slight inflammatory cell infiltration of phagocytes (▴) were still observed (C). There were no marked differences between the lower dose and the higher dose of rutin, resp. the solvent (not shown).
![Figure 3 Overview of histological findings in endocardium and myocardium after 2-hour haemodynamic study. Staining: haematoxylin–eosin and Goldner's trichrome green. Representatives of control groups (A; rutin 11.5 mg/kg, i.v.) and ISO groups (100 mg/kg, s.c.) involving a premedication with rutin (B; 11.5 mg/kg, i.v.) or sodium bicarbonate (C; the solvent, 2.3 ml/kg, i.v.). In contrast to normal structural architecture in the control groups (A), marked alterations were found after the administration of ISO (B). Although rutin partly ameliorated histopathological changes, local capillary hyperaemia, mild interstitial oedema with dilation or swelling of cardiomyocytes, and slight inflammatory cell infiltration of phagocytes (▴) were still observed (C). There were no marked differences between the lower dose and the higher dose of rutin, resp. the solvent (not shown).](/cms/asset/b1c62dd9-8c1e-45c6-8963-77185f77cd00/yrer_a_1159817_f0003_c.jpg)
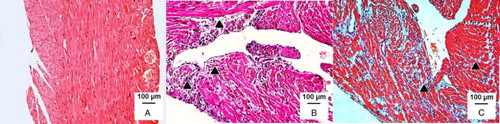
Table 1 Semi-quantitative analysis of histopathological changes in epicardium, myocardium, and endocardium of the left ventricle after 2-hour haemodynamic study
Figure 4 GSSG (A), the GSH/GSSG ratio (B), and GSHt (C) in the H9c2 cell line exposed to rutin (Ru, 1–1000 µM), ISO (0.1–1000 µM), or their combination, i.e. ISO (0.1–1000 µM) and Ru (1000 µM). Data are expressed as means ± SEM of at least two independent experiments, which were performed in duplicates. The statistical analysis was performed using one-way ANOVA followed by Tukey's multiple comparison test. Statistical significance: *P < 0.05 vs. control; – P < 0.05 vs. Ru 1000 µM.
![Figure 4 GSSG (A), the GSH/GSSG ratio (B), and GSHt (C) in the H9c2 cell line exposed to rutin (Ru, 1–1000 µM), ISO (0.1–1000 µM), or their combination, i.e. ISO (0.1–1000 µM) and Ru (1000 µM). Data are expressed as means ± SEM of at least two independent experiments, which were performed in duplicates. The statistical analysis was performed using one-way ANOVA followed by Tukey's multiple comparison test. Statistical significance: *P < 0.05 vs. control; – P < 0.05 vs. Ru 1000 µM.](/cms/asset/634b1446-c6a3-4a9a-916d-f73080e56533/yrer_a_1159817_f0004_b.gif)
Figure 5 Changes of the free fraction of 8-isoprostane in plasma following the administration of the solvent (sodium bicarbonate, SB, 4.6 ml/kg, i.v.) or rutin (Ru, 46 mg/kg, i.v.), i.e. controls, and their combination with ISO (100 mg/kg, s.c.). The changes were calculated vs. baseline level (at time 0 minute, before ISO administration). Data are expressed as means ± SEM. Each sample was tested at least in duplicate. Two-way ANOVA showed significant differences between means of data sets (P < 0.001).
![Figure 5 Changes of the free fraction of 8-isoprostane in plasma following the administration of the solvent (sodium bicarbonate, SB, 4.6 ml/kg, i.v.) or rutin (Ru, 46 mg/kg, i.v.), i.e. controls, and their combination with ISO (100 mg/kg, s.c.). The changes were calculated vs. baseline level (at time 0 minute, before ISO administration). Data are expressed as means ± SEM. Each sample was tested at least in duplicate. Two-way ANOVA showed significant differences between means of data sets (P < 0.001).](/cms/asset/4a46fb4b-cd9f-4eb8-b792-0b6ffdf10747/yrer_a_1159817_f0005_b.gif)
Figure 6 Intracellular ROS formation in H9c2 cardiomyoblasts determined using the H2DCF-DA assay after 2-hour treatment with ISO (0.1–1000 µM), rutin (Ru, 0.1–1000 µM), or their combination, i.e. ISO (0.1–1000 µM) and Ru (1000 µM). Data are expressed as means ± SEM; n = 3. The statistical analysis was performed using one-way ANOVA followed by Tukey's multiple comparison test. Statistical significance: *P < 0.05 vs. control; + P < 0.05, ++ P < 0.01, and +++ P < 0.001 vs. the corresponding ISO group without rutin.
![Figure 6 Intracellular ROS formation in H9c2 cardiomyoblasts determined using the H2DCF-DA assay after 2-hour treatment with ISO (0.1–1000 µM), rutin (Ru, 0.1–1000 µM), or their combination, i.e. ISO (0.1–1000 µM) and Ru (1000 µM). Data are expressed as means ± SEM; n = 3. The statistical analysis was performed using one-way ANOVA followed by Tukey's multiple comparison test. Statistical significance: *P < 0.05 vs. control; + P < 0.05, ++ P < 0.01, and +++ P < 0.001 vs. the corresponding ISO group without rutin.](/cms/asset/e41edb67-6f6c-41b6-89ae-88ed3235ae0d/yrer_a_1159817_f0006_b.gif)