Figures & data
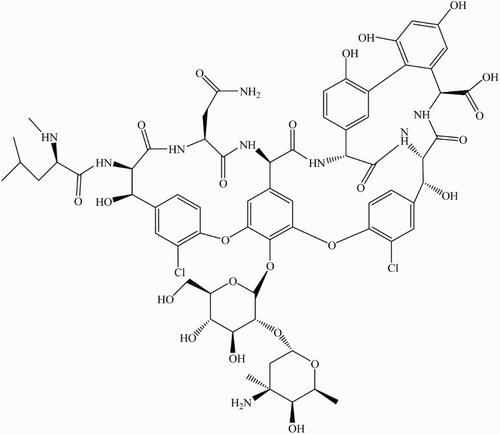
Scheme 1 Chemical structure of vancomycin (Vanco).
Scheme 2 Possible reactions pathways for the visible-light mediated photosensitized degradation of Vanco (A) and reaction of ROS with specific auxiliary quenchers. S: sensitizer (Rose Bengal or riboflavin).
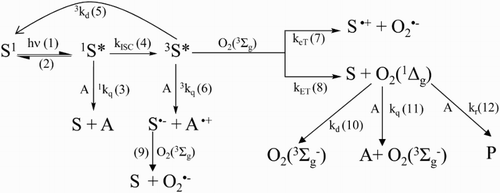
Figure 1 Spectral changes of 0.1 mM vancomycin + 0.02 mM riboflavin vs. 0.02 mM riboflavin upon visible light photoirradiation in aqueous solution at pH 7.4. The numbers on the spectra represent irradiation time in min. Inset I: Relative rates of oxygen uptake (v−ΔO2) of: (a) 0.02 mM riboflavin + 0.5 mM vancomycin; (b) 0.02 mM riboflavin + 0.5 mM vancomycin + 1 mM sodium azide; (c) 0.02 mM riboflavin + 0.5 mM vancomycin + 1 mg/100 ml superoxide dismutase; (d) 0.02 mM riboflavin + 0.5 mM vancomycin + 10 mM d-mannitol; (e) 0.02 mM riboflavin + 0.5 mM vancomycin + 1 mg/100 ml catalase. Inset II: Spectral changes in Argon-saturated solution of 0.02 mM riboflavin upon visible light photoirradaition (a) without vancomycin and non-irradiated; (b) without vancomycin, 5 minutes irradiation; (c) in the presence of 0.5 mM vancomycin, 5 minutes irradiation. Solvent: aqueous solution at pH 7.4.
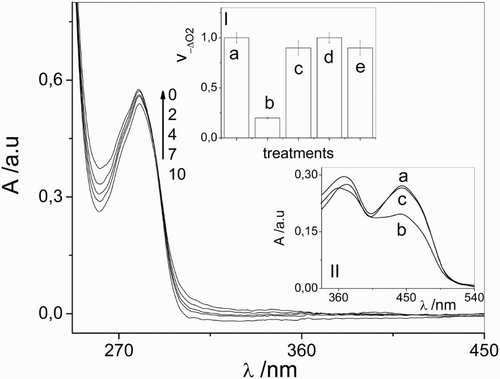
Figure 2 Transient absorption spectra of (a) 0.01 mM riboflavin and (b) 0.01 mM riboflavin + 0.05 mM vancomycin taken at 1 and 30 μs after the laser pulse, respectively, in Argon-saturated aqueous solutions. Inset I: Stern–Volmer plot for the interaction of 3Rf* with vancomycin. Inset II: transient absorption spectra of (a) 0.01 mM riboflavin (1 μs) and (b) 0.01 mM riboflavin + 0.05 mM vancomycin (30 μs) normalized at 670 nm, in Argon-saturated aqueous solutions.
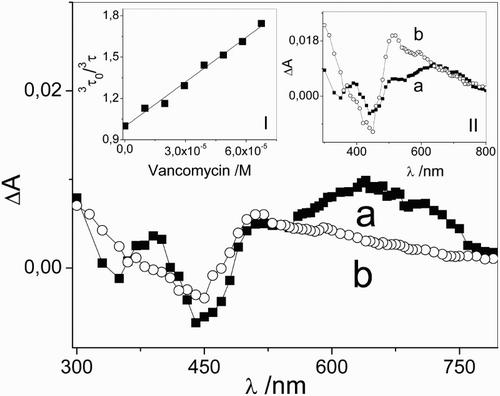
Figure 3 Spectral evolution of 0.1 mM vancomycin upon sensitized photoirradiation with visible light in aqueous solution in the presence of Rose Bengal (A549 nm = 0.5) of vancomycin/Rose Bengal vs. Rose Bengal at pH 11. Inset: Spectral evolution of 0.1 mM vancomycin upon sensitized photoirradiation with visible light in aqueous solution in the presence of Rose Bengal (A549 nm = 0.5) of vancomycin/Rose Bengal vs. Rose Bengal at pH 7.4. The numbers on the spectra represent irradiation time in minuite.
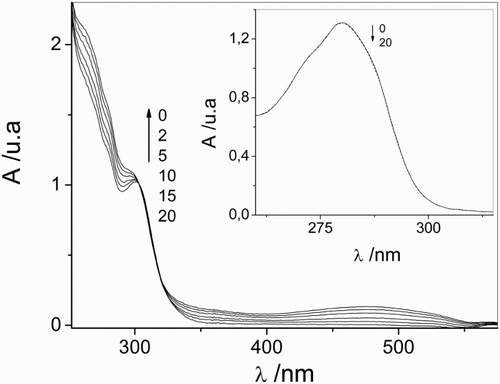
Figure 4 First-order plots for 0.5 mM vancomycin consumption plus Rose Bengal (A549 nm = 0.5) in aqueous solution at (a) pH 7.4 and (b) pH 11. Inset: Stern–Volmer plots for the quenching of O2 (1Δg)-phosphorescence emission by vancomycin in Rose Bengal (A532 nm = 0.3)/D2O at (a) pD 7.4 and (b) pD 11.
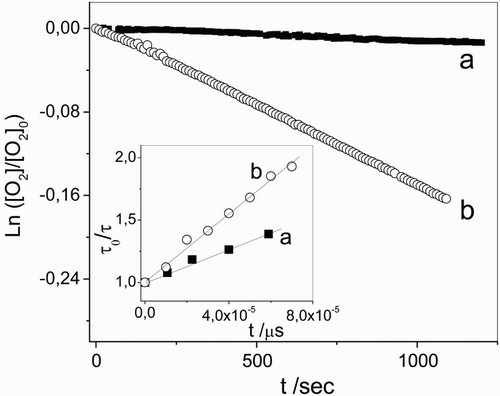
Table 1 Overall (kt) and reactive (kr) rate constants for the interaction of O2(1Δg) with vancomycin at pH/pD 7.4 and 11 in the presence of RB; kr/kt ratio
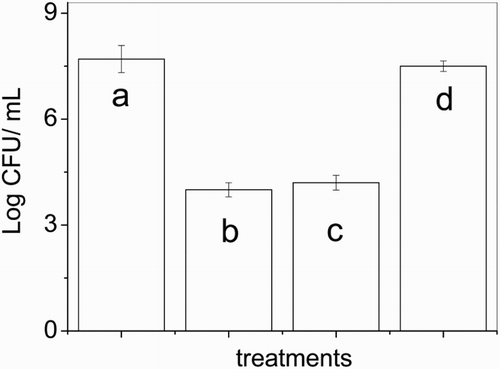
Figure 5 Effect of 0.75 mg/l vancomycin: (c) before and (d) after 2.5 h Rose Bengal-sensitized photolysis on S. aureus ATCC 25923; (a) cellular control without vancomycin; (b) cellular control with vancomycin and without Rose Bengal.