Figures & data
Table 1. Body weight gain and organo-somatic indices (OSI) of the testes and epididymis in rats exposed to VCD for 28 consecutive days.
Figure 1. Superoxide dismutase (SOD) and catalase (CAT) activities in testes and epididymis following 28 consecutive days of VCD treatment in rats. Each bar represents mean ± SD of 10 rats. aP < 0.05 versus Control.
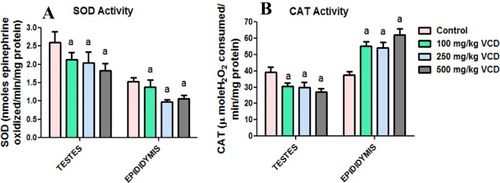
Figure 2. Glutathione peroxidase (GPx) and glutathione S-transferase (GST) activities in testes and epididymis following 28 consecutive days of VCD treatment in rats. Each bar represents mean ± SD of 10 rats. aP < 0.05 versus Control.
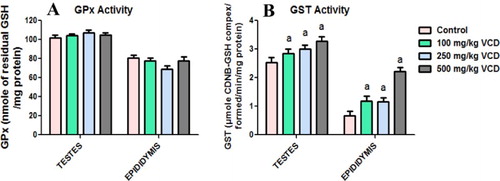
Figure 3. Glutathione (GSH), hydrogen peroxide production (H2O2) and lipid peroxidation levels in testes and epididymis following 28 consecutive days of VCD treatment in rats. Each bar represents mean ± SD of 10rats. aP < 0.05 versus Control.
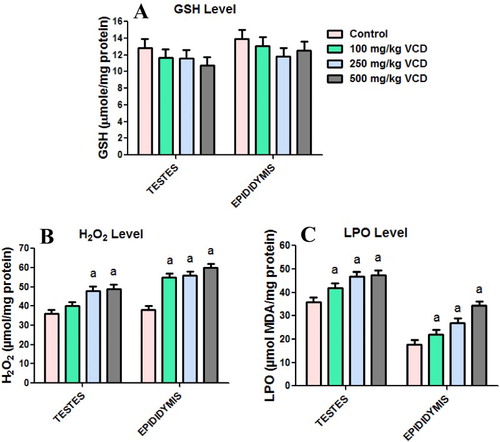
Figure 4. Epididymal sperm motility, count, viability and abnormalities in experimental rats following 28 consecutive days of VCD treatment in rats. Each bar represents mean ± SD of 10 rats. aP < 0.05 versus Control.
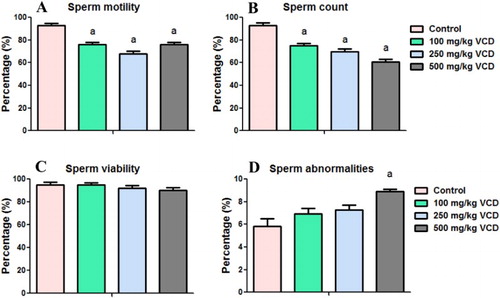
Figure 5. Testicular sperm number and daily sperm production in experimental rats following 28 consecutive days of VCD treatment in rats. Each bar represents mean ± SD of 10 rats. aP < 0.05 versus Control.
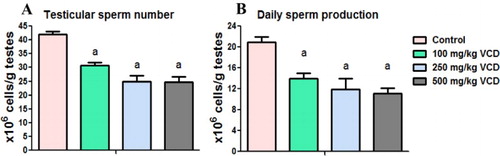
Figure 6. Circulatory concentrations of follicle-stimulating hormone (FSH), luteinizing hormone (LH) and testosterone in experimental rats following 28 consecutive days of VCD treatment in rats. Each bar represents mean ± SD of 10 rats. aP < 0.05 versus Control.
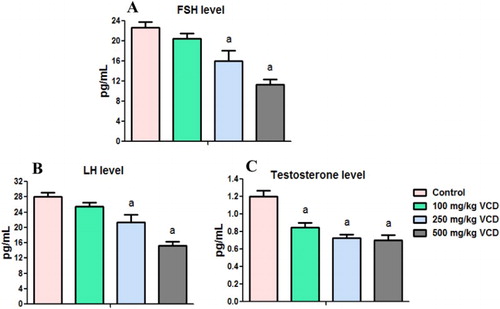
Figure 7. Representative photomicrographs of testes and epididymis from control and VCD-treated rats. Control testes (A1) and epididymis (A2) showed normal morphology. Treatment-related lesions such as mild congestion, edema and reduced sperm numbers in the testes of 100 mg/kg VCD-treated rats (B1) whereas 250 and 500 mg/kg VCD-treated rats showed marked degeneration of the seminiferous tubules (C1 and D1). Epididymis of 100 and 250 mg/kg VCD-treated rats showed lumen with few viable sperm cells (B2 and C2) whereas 500 mg/kg VCD-treated rats showed reduced epithelia layer integrity with some empty lumen (D2).
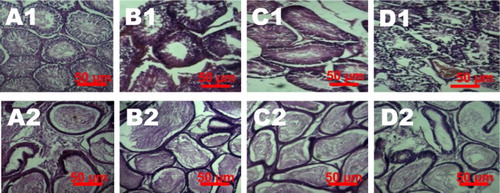
Figure 8. Testes histopathology guide showing the influence of VCD on COX-2 and iNOS expression in control and treated rats. Percentage of positive cells is presented in the graphs (e and f). Each bar represents mean ± SD of 10 rats per group. aValues differ significantly from control (P < 0.05).
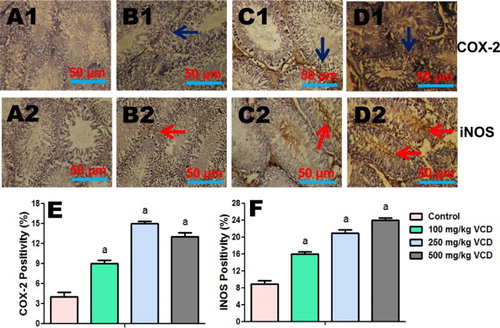
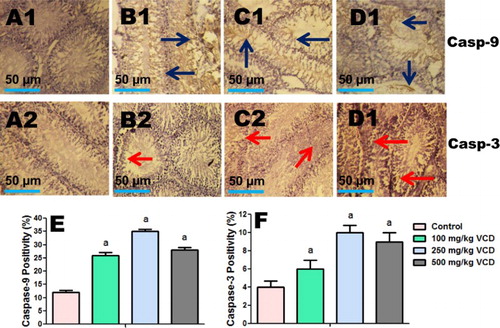
Figure 9. Testes histopathology guide showing the influence of VCD on caspase-9 and caspase-3 expression in control and treated rats. Percentage of positive cells is presented in the graphs (e and f). Each bar represents mean ± SD of 10 rats per group. aValues differ significantly from control (P < 0.05).