Figures & data
Table 1. Characterization of metals in residual oil fly ash.
Figure 1. Body mass before and after 12 weeks of chromium picolinate (CrPic) supplementation and aerobic exercise intervention in rats exposed to residual oil fly ash (ROFA). Values presented as mean ± SD. Statistical analysis: two-way repeated measures analysis of variance (ANOVA) followed by Tukey’s post hoc test. ROFA-SED, ROFA exposure and sedentary (n = 8); ROFA-SED-CrPic, ROFA exposure, sedentary and supplemented (n = 6); ROFA-AT, ROFA exposure and trained (n = 8); ROFA-AT-CrPic, ROFA exposure, supplemented and trained (n = 7); Sal-SED, sedentary (n = 8); Sal-SED-CrPic, sedentary and supplemented (n = 8); Sal-AT, trained (n = 8); Sal-AT-CrPic, supplemented and trained (n = 8). Symbols represent comparisons among groups based on the post hoc analysis: &P < .05 vs. Initial Body Mass; *P < .05 vs. ROFA-SED; @P < .05 vs. ROFA-SED-CrPic; #P < .05 vs. Sal-SED; †P < .05 vs. Sal-SED-CrPic.
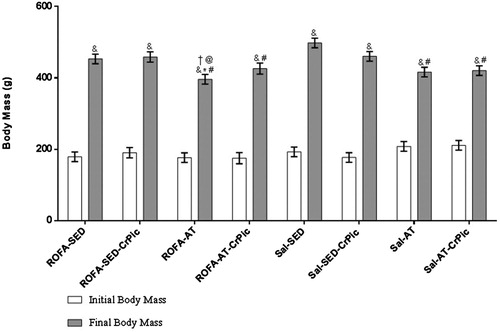
Figure 2. Exercise tolerance test before and after 12 weeks of chromium picolinate (CrPic) supplementation and aerobic exercise intervention in rats exposed to residual oil fly ash (ROFA). (a) Initial exercise tolerance test; (b) final time of exercise tolerance test. Values presented as mean ± SD. Statistical analysis: one-way ANOVA followed by Tukey’s post hoc test. ROFA-SED, ROFA exposure and sedentary (n = 8); ROFA-SED-CrPic, ROFA exposure, sedentary and supplemented (n = 6); ROFA-AT, ROFA exposure and trained (n = 8); ROFA-AT-CrPic, ROFA exposure, supplemented and trained (n = 7); Sal-SED, sedentary (n = 8); Sal-SED-CrPic, sedentary and supplemented (n = 8); Sal-AT, trained (n = 8); Sal-AT-CrPic, supplemented and trained (n = 8). Symbols represent comparisons among groups based on the post hoc analysis: *P < .05 vs. ROFA-SED; @ P < .05 vs. ROFA-SED-CrPic; # P < .05 vs. Sal-SED; †P < .05 vs. Sal-SED-CrPic.
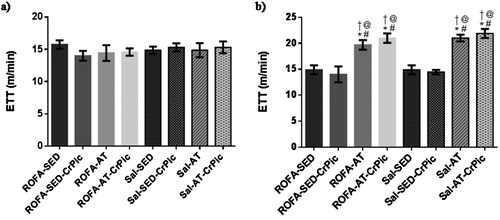
Figure 3. Oxidative stress in lung tissue after 12 weeks of chromium picolinate (CrPic) supplementation and aerobic exercise intervention in rats exposed to residual oil fly ash (ROFA). Analyses of (a) superoxide dismutase (SOD) activity in lung tissue; (b) catalase (CAT) activity in lung tissue and (c) thiobarbituric acid-reactive substance (TBARS) levels in lung tissue. Values presented as mean ± SD. Statistical analysis: one-way ANOVA followed by Tukey’s post hoc test. ROFA-SED, ROFA exposure and sedentary (n = 8); ROFA-SED-CrPic, ROFA exposure, sedentary and supplemented (n = 6); ROFA-AT, ROFA exposure and trained (n = 8); ROFA-AT-CrPic, ROFA exposure, supplemented and trained (n = 7); Sal-SED, sedentary (n = 8); Sal-SED-CrPic, sedentary and supplemented (n = 8); Sal-AT, trained (n = 8); Sal-AT-CrPic, supplemented and trained (n = 8).
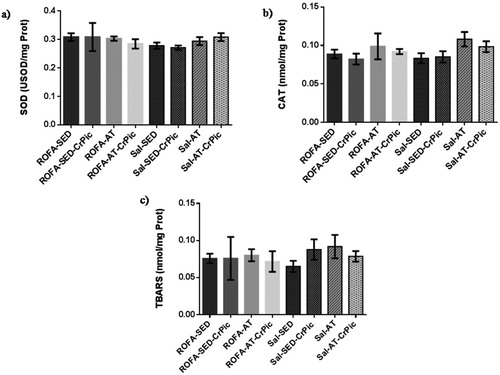
Figure 4. Oxidative stress in heart tissue after 12 weeks of chromium picolinate (CrPic) supplementation and aerobic exercise intervention in rats exposed to residual fly oil ash (ROFA). Analyses of (a) superoxide dismutase (SOD) activity in heart tissue; (b) catalase (CAT) activity in heart tissue and (c) thiobarbituric acid-reactive substance (TBARS) levels in heart tissue. Values presented as mean ± SD. Statistical analysis: one-way ANOVA followed by Tukey’s post hoc test. ROFA-SED, ROFA exposure and sedentary (n = 8); ROFA-SED-CrPic, ROFA exposure, sedentary and supplemented (n = 6); ROFA-AT, ROFA exposure and trained (n = 8); ROFA-AT-CrPic, ROFA exposure, supplemented and trained (n = 7); Sal-SED, sedentary (n = 8); Sal-SED-CrPic, sedentary and supplemented (n = 8); Sal-AT, trained (n = 8); Sal-AT-CrPic, supplemented and trained (n = 8).
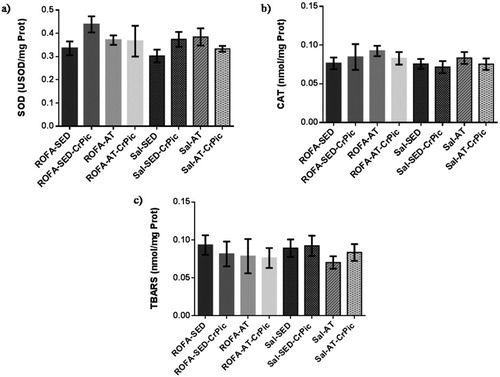
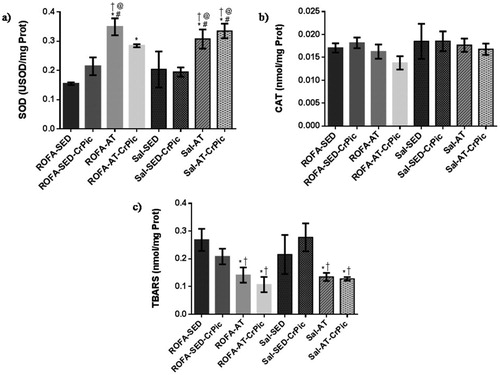
Figure 5. Oxidative stress in gastrocnemius muscle after 12 weeks of chromium picolinate (CrPic) supplementation and aerobic exercise intervention in rats exposed to residual oil fly ash (ROFA). Analyses of (a) superoxide dismutase (SOD) activity in gastrocnemius tissue; (b) catalase (CAT) activity in gastrocnemius tissue and (c) thiobarbituric acid-reactive substance (TBARS) levels in gastrocnemius tissue. Values presented as mean ± SD. Statistical analysis: one-way ANOVA followed by Tukey’s post hoc test. ROFA-SED, ROFA exposure and sedentary (n = 8); ROFA-SED-CrPic, ROFA exposure, sedentary and supplemented (n = 6); ROFA-AT, ROFA exposure and trained (n = 8); ROFA-AT-CrPic, ROFA exposure, supplemented and trained (n = 7); Sal-SED, sedentary (n = 8); Sal-SED-CrPic, sedentary and supplemented (n = 8); Sal-AT, trained (n = 8); Sal-AT-CrPic, supplemented and trained (n = 8). Symbols represent comparisons among groups based on the post hoc analysis: *P < .05 vs. ROFA-SED; @P < .05 vs. ROFA-SED-CrPic; #P < .05 vs. Sal-SED; †P < .05 vs. Sal-SED-CrPic.