
Figures & data
Table 1. PCR primers.
Table 2. Treatment of CKD rat model with ZnO-NP and SPL results in improvement of renal function.
Table 3. Treatment of CKD rat model with ZnO-NP and SPL results in down-regulation of oxidative stress and enhanced antioxidants.
Figure 1. Treatment of CKD rat model with ZnO-NP and SPL results in down-regulation of fibrotic and inflammatory gene expression and enhanced antioxidant gene expression. Significant difference compared to corresponding acontrol group, bCKD group, cSPL group, dZnO-NPs group at p < 0.05 by ANOVA and Tukey test. Regarding levels of relative quantification of TGF-β1 mRNA, Wnt7a mRNA, and β-catenin mRNA (A), relative quantification of FN1 mRNA, Col-IV mRNA, and α-SMA mRNA (B), relative quantification of TNF-α mRNA and IL-6 mRNA (C), and relative quantification of Nrf2 mRNA and HO-1 mRNA (D).
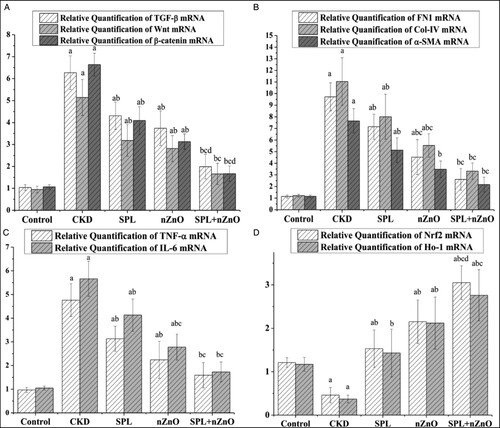
Figure 2. Treatment of CKD rat model with ZnO-NP and SPL results in down-regulation of β-cateninin cytoplasm and up-regulation of Nrf2 in western blot analysis. Significant difference compared to *control group at p < 0.0001 where C: normal control group, D: CKD group, T1: SPL group, T2: ZnO-NPs group, T3: SPL + ZnO-NPs group.
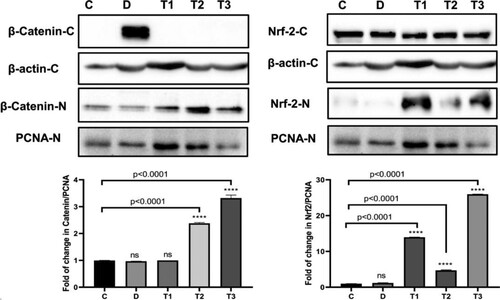
Figure 3. Histopathological examination of the kidney tissues with H&E. (A) The score of tubulointerstitial damage. Microscopic pictures of kidney specimens showing: (B) normal glomerular and tubular kidney structure (normal group, 100×), (C) protein leakage in the tubular lumen (CKD group, 100×), (D) mild interstitial collagen proliferation (bold black arrow) and prominent nuclei (white arrow) (SPL group, 400×), (E) mild congestion (star), mitotic figure (arrowhead) and prominent nuclei (white arrow) (ZnO-NPs group, 400×) and (F) prominent nuclei (white arrow) and mitotic figure (arrowhead) (SPL + ZnO-NPs group, 400×). a: significant difference versus control, b: significant versus CKD, c: significant versus SPL, d: significant versus ZnO-NPs at p < 0.05.
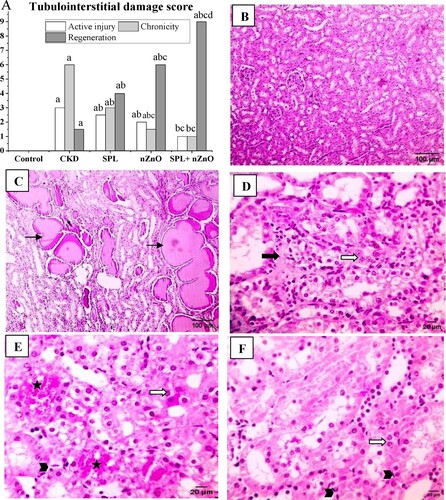
Figure 4. Immunohistopathological examination for β-catenin expression in kidney tissues. (A) The score of β-catenin in all studied groups, (B) negative expression for beta catenin (control group, 400×), (C) marked cytoplasmic expression for beta catenin in both renal tubules and glomeruli (CKD group, 200×), (D) moderate expression of β-catenin in SPL group (200×), (E) mild expression of β-catenin in ZnO-NPs group (200×), and (F) mild expression in SPL + ZnO-NPs group (200×). a: significant difference versus control, b: significant versus CKD, c: significant versus SPL, d: significant versus ZnO-NPs at p < 0.05.
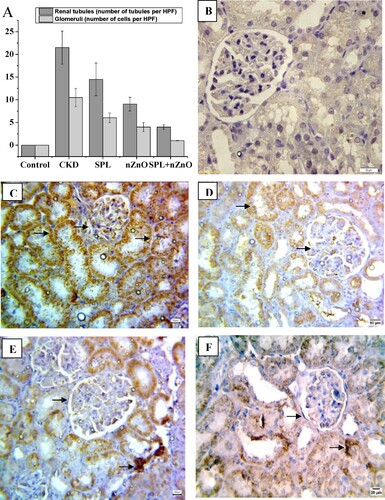
Figure 5. Immunohistopathological examination for TGF-β1 expression in kidney tissues. (A) The score of TGF-β1 in all studied groups, (B) negative expression for TGF-β1 (control group, 400×), (C) marked cytoplasmic expression for TGF-β1 in both renal tubules and glomeruli (CKD group, 200×), (D) moderate expression of TGF-β1 in SPL group (200×), (E) mild expression of TGF-β1 in ZnO-NPs group (200×), and (F) mild expression in SPL + ZnO-NPs group (200×). a: significant difference versus control, b: significant versus CKD, c: significant versus SPL, d: significant versus ZnO-NPs at p < 0.05.
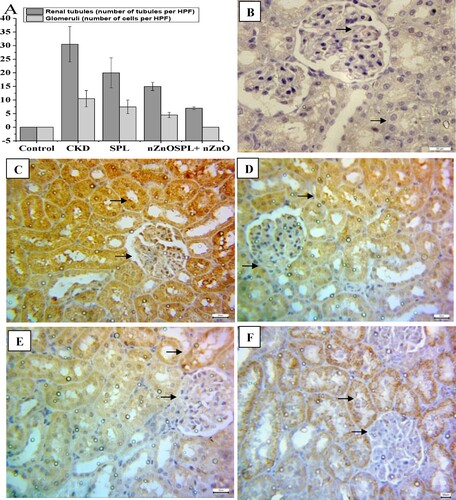
Figure 6. Immunohistopathological examination for α-SMA expression in kidney tissues. (A) The score of α-SMA in all studied groups, (B) negative expression for α-SMA (control group, 400×), (C) marked cytoplasmic expression for α-SMA in both renal tubules and glomeruli (CKD group, 200×), (D) moderate expression of α-SMA in SPL group (200×), (E) mild expression of α-SMA in ZnO-NPs group (200×), and (F) mild expression in SPL + ZnO-NPs group (200×). a: significant difference versus control, b: significant versus CKD, c: significant versus SPL, d: significant versus ZnO-NPs at p < 0.05.
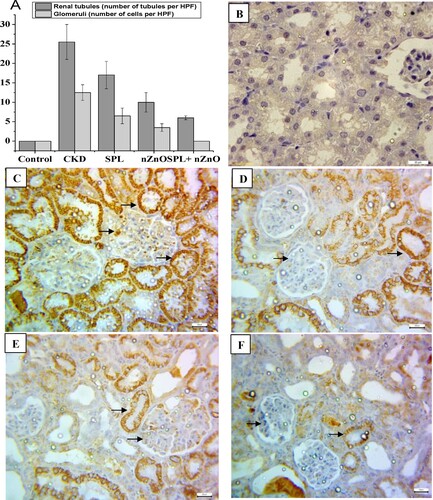
Figure 7. Immunofluorescence investigation of collagen III in kidney tissues showing: (A) mild expression in control group (200×), (B) marked expression in CKD group (200×), (C) moderate expression in SPL group (200×), (D) mild expression in ZnO-NPs group (200×), and (E) mild expression in SPL + ZnO-NPs group (200×).
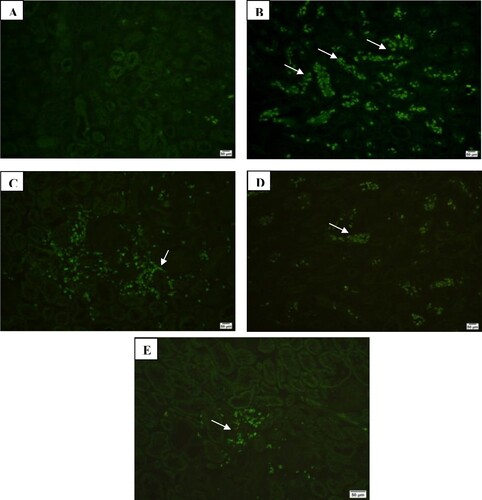
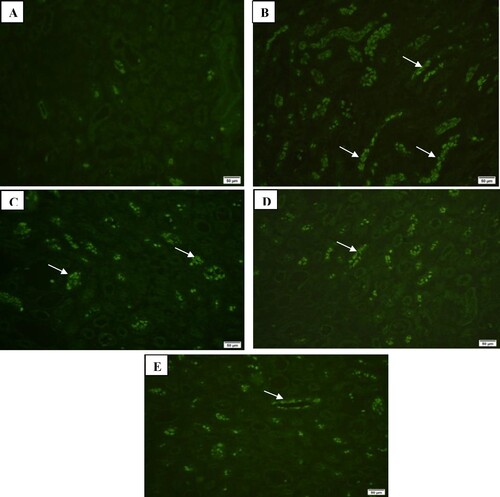
Figure 8. Immunofluorescence investigation of collagen IV in kidney tissues showing: (A) mild expression in control group (200×), (B) marked expression in CKD group (200×), (C) moderate expression in SPL group (200×), (D) mild expression in ZnO-NPs group (200×), and (E) mild expression in SPL + ZnO-NPs group (200×).
Data availability statement
The datasets used and/or analyzed during the current study are available from the corresponding author on reasonable request.