
Figures & data
Figure 1. Government revenue and expenditure as percentage of GDP.
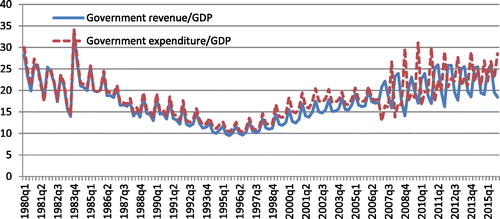
Table 1. Unit root test without structural break at levels.
Table 2. Unit root test without structural break at 1st difference.
Table 3. Critical values of the unit root tests.
Table 4. Unit root test with on endogenous structural break: Zivot-Andrews Test.
Table 5. Unit root test with two endogenous structural breaks: Clemente-Montanes-Reyes test.
Table 6. Unit root test with one structural break: Lee Strazicich LM unit root test.
Table 7. Unit root test with two structural breaks: Lee Strazicich LM unit root test.
Table 8. Toda-Yamamoto causality test results.
Figure 2. Time series plot and wavelet decomposition of the government revenue as a share of GDP.
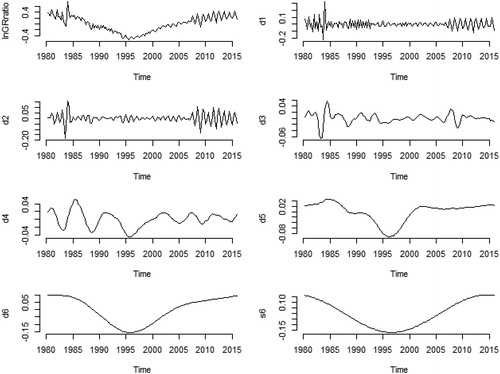
Figure 3. Time series plot and wavelet decomposition of the government expenditure as a share of GDP.
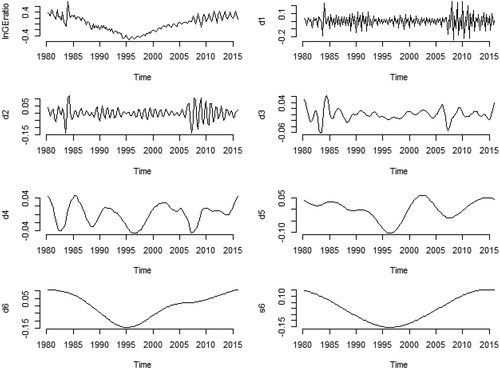
Table 9. Unit root test using wavelet filtered data (wavelet details).
Table 10. Granger causality test results using wavelet details.