
Figures & data
Figure 1. Actual FDI inflows in China, 1979–2018.
Sources: China Statistical Yearbooks (1999–2019); China Statistical Data of 50 Years 1949–1998.
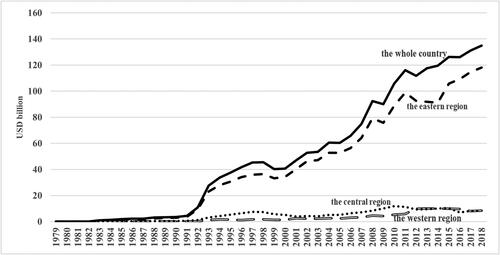
Figure 2. Actual FDI inflows in BRI and non-BRI provinces in China, 1979–2018.
Sources: China Statistical Yearbooks (1999–2019); China Statistical Data of 50 Years 1949–1998.
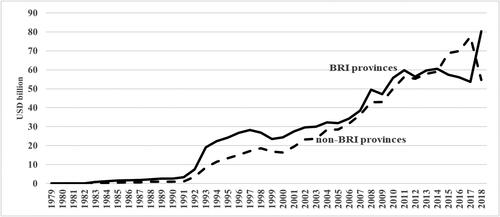
Table 1. Summary statistics.
Table 2. The determinants of FDI in China 1979–2018: Long-run static model.
Table 3. The determinants of FDI in China: Long-run heterogeneity across regions.
Table 4. The determinants of FDI in China: Long-run heterogeneity over time.
Table 5. The determinants of FDI in China: Short-run heterogeneity across regions.
Table 6. Short-run and long-run elasticities across regions.
Table 7. The determinants of FDI in China: Short-run heterogeneity over time.
Table 8. Short-run and long-run elasticities over time.
Table 9. Impact of the Belt and Road Initiative (BRI) on FDI.