Figures & data
Table 1. Results of the multiple linear regressions to predict intention toward physical activity.
Table 2. Results of the multiple linear regressions to predict intention toward healthy diet.
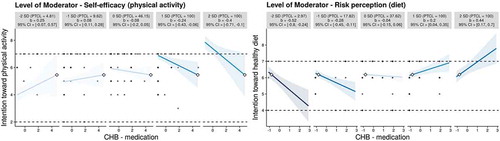
Figure 1. Moderation of self-efficacy-intention and risk perception-intention relationships by CHB-medication. Because similar patterns of results were observed for all significant interactions, plots for the other CHBs are in the supplemental materials file. Simple slopes are provided for levels of the moderator 2 SD and 1 SD below and above the mean, and at the mean. Graphs show the computed 95% confidence region (shaded area), the observed data (grey circles), the maximum and minimum values of the outcome (dashed horizontal lines), and the crossover point (diamond). PTCL = percentile.