
Figures & data
Figure 1. The Prototype Willingness model
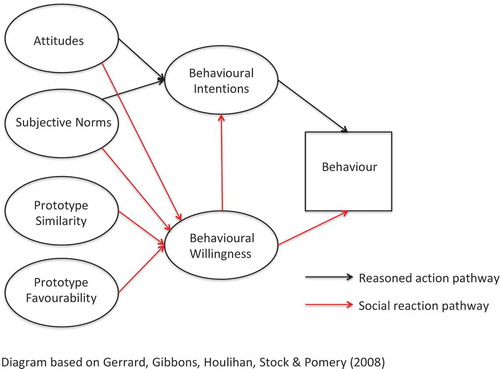
Table 1. Mean daily average MVPA, by sex (n = 126)
Table 2. Median scores on reasoned action and social reaction variables, by sex (n = 126)
Table 3. Hierarchical linear regression model of physical activity in adolescents (n = 126)