Figures & data
Table 1. Demographic variables, mean 4DSQ scores, and reliability (Cronbach’s alpha and McDonald’s omega) of the US sample (N = 159) and the Dutch sample (N = 159)
Table 2. Goodness of fit indices of the multi-group CFA for one-factor models fitted to the data of each scale depending on residual correlations allowed
Table 3. Items identified with significant differential item functioning (DIF)
Table 4. Differences in cutoff points according to differential test functioning (DTF)
Table 5. Pearson product–moment correlation coefficients and beta coefficients (linear multivariate regression analysis) indicating relationships between 4DSQ and OQ-45 total score and subscale scores (n = 150)
Table 6. Differences in 4DSQ between patients diagnosed with a depressive disorder or anxiety disorder and another mental health condition
Table 7. Logistic regression analysis with mood disorder or anxiety disorder as dependent variable and 4DSQ scores as independent variables (n = 60)
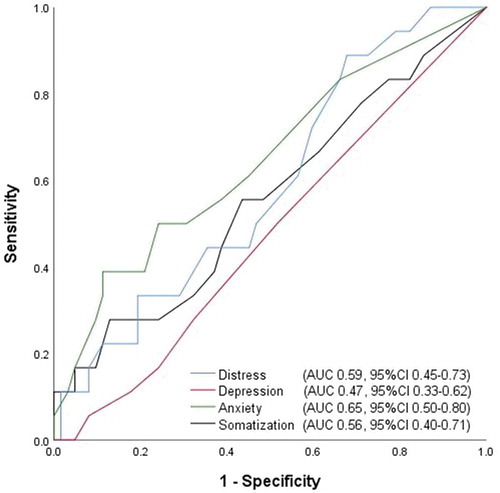
Figure 1. Receiver operating characteristic (ROC) curves of 4DSQ scales with respect to detecting a mood disorder diagnosis in an outpatient psychotherapy sample (n = 60). AUC=area under the curve, 95%CI=95% confidence interval
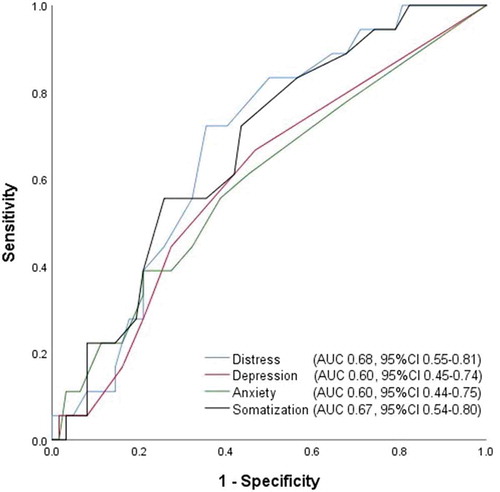
Figure 2. Receiver operating characteristic (ROC) curves of 4DSQ scales with respect to detecting an anxiety disorder diagnosis in an outpatient psychotherapy sample (n = 60). AUC=area under the curve, 95%CI=95% confidence interval