Figures & data
Figure 1. Types and numbers of interventions assessed for acceptability, by acceptability studies with young people in Africa (2010–2020).
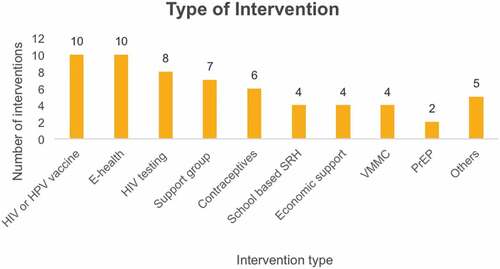
Table 1. Themes emerging from our systematic review thematic analyses in relation to components of Sekhon et al.’s (Citation2017) TFA.
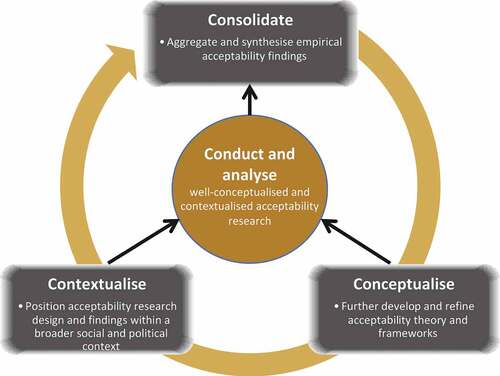
Figure 2. Potential cycle of inductive-deductive acceptability empirical research and theory building.