Kristiina KompusDepartment of Biological and Medical Psychology, University of Bergen, Bergen, Norway;NORMENT Center of Excellence, University of Oslo, Oslo, NorwayView further author information
&
Kenneth HugdahlDepartment of Biological and Medical Psychology, University of Bergen, Bergen, Norway;NORMENT Center of Excellence, University of Oslo, Oslo, Norway;Division of Psychiatry, Haukeland University Hospital, Bergen, Norway;Department of Radiology, Haukeland University Hospital, Bergen, NorwayView further author information
Pages 434-452
|
Received 30 Sep 2014, Accepted 05 Dec 2014, Published online: 14 Jan 2015
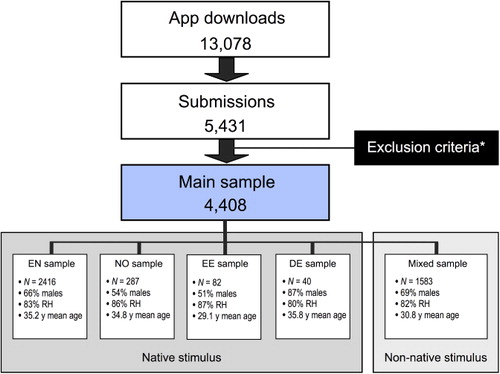
Figure 1. Flow-chart depicting sample selection process and characteristics of sub-samples. *See separate section under Methods. RH = Right-handed. y = years. N = number of subjects. EN = English; NO = Norwegian; EE = Estonian; DE = German.
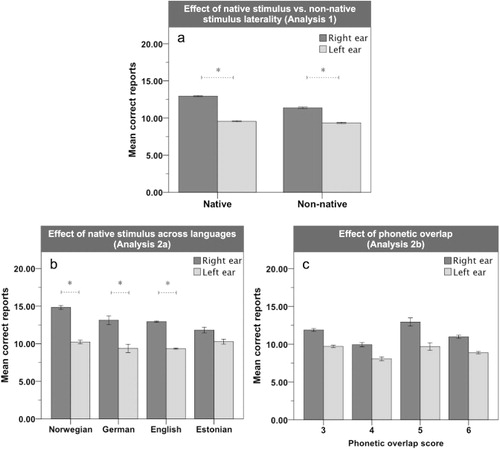
Figure 2. Three charts depicting the mean correct reports from the right and the left ear comparing (a) the native-stimulus vs. non-native stimulus sample, (b) native-stimulus sub-samples and (c) the non-native languages grouped by phonetic overlap. y-axis = 30 max. Error bars = standard error (SE). *Significant (p < .05) post-hoc pairwise comparisons.
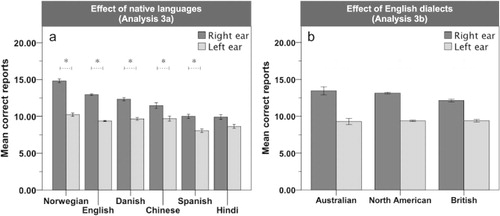
Figure 3. Charts depicting the mean correct reports from the right and the left ear comparing (a) the largest (n > 100) language groups of the main sample, and (b) the three largest (n > 30) English-dialect groups. y-axis = 30 max. Error bars = standard error (SE). *Significant (p < .05) post-hoc pairwise comparisons.