
Figures & data
Figure 1. Histograms of the raw (a) and natural log transformed (b) scores for perinatal umbilical cord free testosterone.
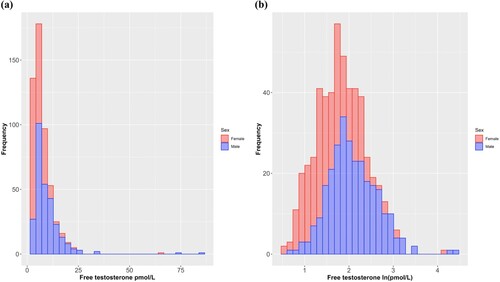
Table 1. Descriptive statistics for hormonal, sociodemographic, obstetric, antenatal, and handedness variables.
Figure 2. Boxplots for relative hand skill LI (signed) stratified by hand preference (right or left) at Y10 (a) and Y16 (b).
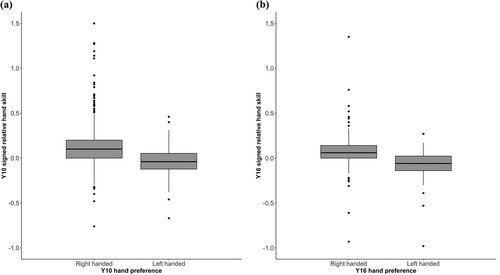
Table 2. Bootstrapped (10,000 samples) Pearson’s correlations between hormonal predictors and handedness outcomes, stratified by sex.
Table 3. Bootstrapped (10,000 samples) multivariate regression models with hormones as predictors and handedness measures as outcomes.
Table 4. Bootstrapped (10,000 samples) multivariate regression models with Vitamin D and Vitamin D × sex as predictors and handedness measures as outcomes.
Table 5. Qualitative summary of results from bivariate and multivariate analyses of association between perinatal hormone concentrations and handedness outcomes measured at Y10 and Y16.
Figure 3. Violin plots for free testosterone (a), total estradiol (b), and Vitamin D (25[OH]D) (c) stratified by Y10 hand preference (right or left).
![Figure 3. Violin plots for free testosterone (a), total estradiol (b), and Vitamin D (25[OH]D) (c) stratified by Y10 hand preference (right or left).](/cms/asset/bc807e2d-d1e5-4d1e-ad7c-b8c800c65922/plat_a_2109656_f0003_oc.jpg)
Figure 4. Scatterplot showing a negative correlation between maternal gestational Vitamin D (25[OH]D) concentration and relative hand skill (unsigned finger tapping LI) measured at Y16.
Note. Scatterplot shows all available (unadjusted) data points (i.e., it includes those of participants who were deleted listwise in the multiple linear regression models); higher unsigned relative hand skill values indicate greater difference in speed between the right and left hands.
![Figure 4. Scatterplot showing a negative correlation between maternal gestational Vitamin D (25[OH]D) concentration and relative hand skill (unsigned finger tapping LI) measured at Y16.Note. Scatterplot shows all available (unadjusted) data points (i.e., it includes those of participants who were deleted listwise in the multiple linear regression models); higher unsigned relative hand skill values indicate greater difference in speed between the right and left hands.](/cms/asset/4a920dae-ecd9-458c-8fcb-8e0b675d9564/plat_a_2109656_f0004_oc.jpg)
Data availability statement
The data that support the findings of this research are available from The Raine Study (https://rainestudy.org.au/information-for-researchers/). Restrictions apply to the availability of these data, which were used under license for this study. The R script that accompanies our analysis is available on the Open Science Framework (https://osf.io/yru2s/).