
Figures & data
Figure 1. A schematic illustration of the four laterality models: (A) dissociable laterality, (B) modality laterality, (C) stimuli laterality, and (D) unitary laterality.
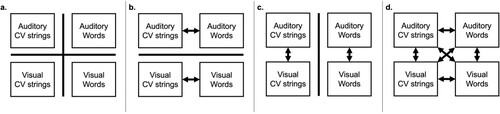
Figure 2. A schematic illustration of each of the four behavioural laterality tasks (not to scale).
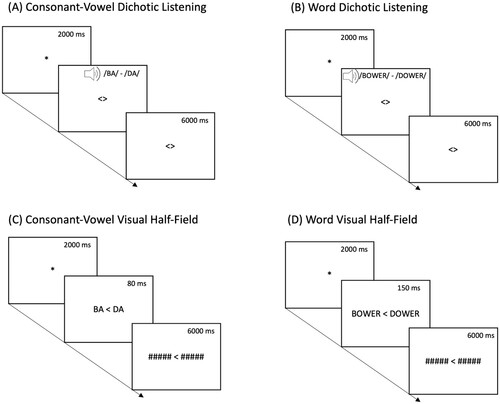
Figure 3. Count of correctly identified stimuli presented to the left and right ear/visual field across each behavioural task: (A) consonant-vowel dichotic listening, (B) word dichotic listening, (C) consonant-vowel visual half-field, and (D) word visual half-field. Dots represent the count of correct answers for each participant.
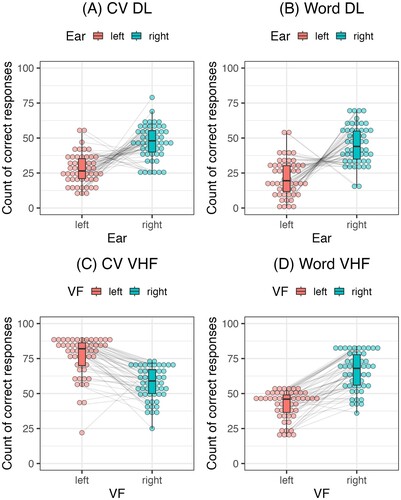
Figure 4. Count of correctly identified stimuli presented to the left and right ear/visual field across each experimental block for the four behavioural laterality tasks: (A) consonant-vowel dichotic listening, (B) word dichotic listening, (C) consonant-vowel visual half-field, and (D) word visual half-field. Dots represent the count of correct answers for each participant.
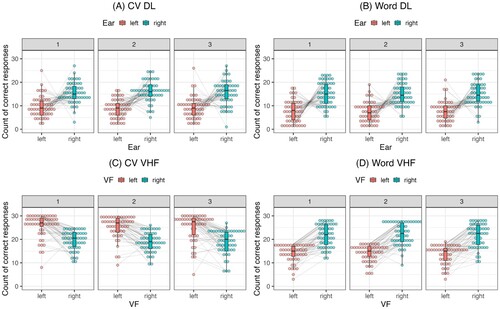
Table 1. Laterality indices, split-half reliability, and disattenuated and attenuated correlation coefficients.
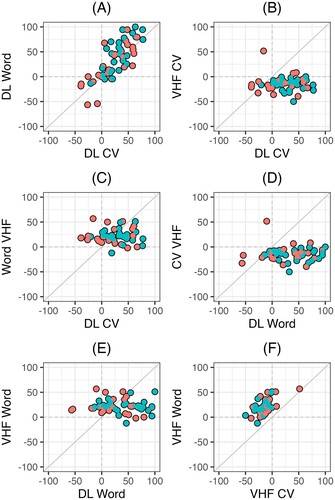
Figure 5. Scatter plots visualizing the relationships between laterality indices across each of the four behavioural tasks: (A) consonant-vowel dichotic listening and word dichotic listening, (B) consonant-vowel dichotic listening and consonant-vowel visual half-field, (C) consonant-vowel dichotic listening and word visual half-field, (D) word dichotic listening and consonant-vowel visual half-field, (E) word dichotic listening and word visual half-field, and (F) consonant-vowel visual half-field and word visual half-field. Dots represent laterality indices for each participant. Left-handed participants are shown in pink and right-handed participants are shown in blue.
Data availability statement
The materials and the data sets generated and analysed are available in the Open Science Framework (OSF) repository, https://osf.io/72sk6/. This repository also includes an R Markdown script to reproduce all analyses and generate the manuscript.