
Figures & data
Figure 1. Confocal fluorescence microscopy image obtained from a sample of 1% (w) hexadecylamine-capped CdSe quantum dots in the host FELIX-2900-03. The intensity distribution in the (x,z)-plane (side view) strongly indicates that the luminescent NPs are residing at the LC/substrate interfaces. The directions for x and z correspond to the definitions in . Reproduced from Urbanski et al. [Citation63] with permission by Wiley-VCH.
![Figure 1. Confocal fluorescence microscopy image obtained from a sample of 1% (w) hexadecylamine-capped CdSe quantum dots in the host FELIX-2900-03. The intensity distribution in the (x,z)-plane (side view) strongly indicates that the luminescent NPs are residing at the LC/substrate interfaces. The directions for x and z correspond to the definitions in Figure 4. Reproduced from Urbanski et al. [Citation63] with permission by Wiley-VCH.](/cms/asset/78b42c49-2917-4f57-aad3-1ca06490f7fc/tlcy_a_1059586_f0001_c.jpg)
Figure 2. Results of a two- and three-dimensional microscopic study on nanoparticle induced birefringent stripe patterns. (a) Monochromatic (λ = 589 nm) polarising microscopy image of a birefringent stripe texture in NP-induced homeotropic surrounding in a dispersion containing 3% (w) dodecylthiol-capped gold NPs in FELIX-2900-03. (b) Schematic drawing of the three possible director configurations that can lead to birefringent stripes in homeotropic alignment. FCPM measurements identified the birefringent stripes to be twist disclinations. (c) Spectrally resolved FCPM images of a sample consisting of 1% (w) hexadecylamine-capped CdSe quantum dots, 0.001% (w) of the dichroic fluorescent dye BTBP (N,N′-bis(2,5-di-tert-butylphenyl)-3,4,9,10-perylendicarboximide) and the nematic liquid crystal FELIX-2900-03. It is shown that the birefringent stripe is pinned to a macroscopic agglomerate of CdSe quantum dots, while no accumulation of NPs within the birefringent stripe is detected. Reproduced from Urbanski et al.[Citation52] with permission by Taylor & Francis Ltd.
![Figure 2. Results of a two- and three-dimensional microscopic study on nanoparticle induced birefringent stripe patterns. (a) Monochromatic (λ = 589 nm) polarising microscopy image of a birefringent stripe texture in NP-induced homeotropic surrounding in a dispersion containing 3% (w) dodecylthiol-capped gold NPs in FELIX-2900-03. (b) Schematic drawing of the three possible director configurations that can lead to birefringent stripes in homeotropic alignment. FCPM measurements identified the birefringent stripes to be twist disclinations. (c) Spectrally resolved FCPM images of a sample consisting of 1% (w) hexadecylamine-capped CdSe quantum dots, 0.001% (w) of the dichroic fluorescent dye BTBP (N,N′-bis(2,5-di-tert-butylphenyl)-3,4,9,10-perylendicarboximide) and the nematic liquid crystal FELIX-2900-03. It is shown that the birefringent stripe is pinned to a macroscopic agglomerate of CdSe quantum dots, while no accumulation of NPs within the birefringent stripe is detected. Reproduced from Urbanski et al.[Citation52] with permission by Taylor & Francis Ltd.](/cms/asset/e0163684-345b-44c7-a974-f27ce02a2469/tlcy_a_1059586_f0002_c.jpg)
Figure 3. Schematic summary of the nanoparticle-induced dual alignment and reverse switching modes. Left: Slow cooling of a dispersion containing 5% (w) dodecylthiol-capped gold NPs in FELIX-2900-03 from the isotropic to the nematic phase induces homeotropic alignment in the field-OFF state. Low frequent AC fields then cause the formation of birefringent convection rolls which constitute the observed reverse switching mode. Right: Cooling the same test cell from isotropic to the nematic phase with external AC field-ON induces planar alignment when the electric field is switched OFF. External electric fields then allow the dispersion to undergo the ‘normal’ switching mode for hosts with positive dielectric anisotropy, a Fréedericksz-transition is observed.
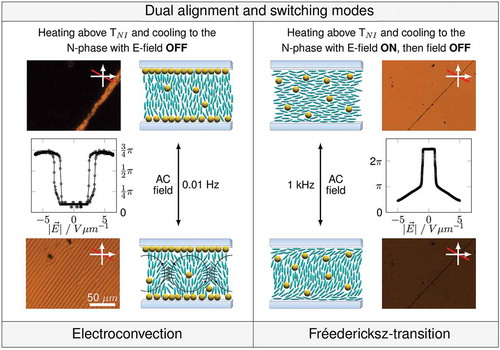
Figure 4. Illustration of cell geometry in the field OFF state (left) and under the influence of an external electric field (right). Reproduced from Urbanski et al. [Citation63] with permission by Wiley-VCH.
![Figure 4. Illustration of cell geometry in the field OFF state (left) and under the influence of an external electric field (right). Reproduced from Urbanski et al. [Citation63] with permission by Wiley-VCH.](/cms/asset/3489ce0b-5767-4850-a06f-da3a914ada29/tlcy_a_1059586_f0004_c.jpg)
Figure 5. Fitting results for hexadecylamine-capped CdSe quantum dots in the host 5CB. (a) Elastic constant K11 for splay deformations. (b) Initial tilt angle θ0. Nanoparticle doping leads to a slight decrease of elastic constant, which is in accordance to earlier observations. Additionally, a pronounced increase of initial tilt angle is found, presumably caused by NPs residing at the initial alignment layers of the test cell. Reproduced from Urbanski et al.[Citation63] with permission by Wiley-VCH.
![Figure 5. Fitting results for hexadecylamine-capped CdSe quantum dots in the host 5CB. (a) Elastic constant K11 for splay deformations. (b) Initial tilt angle θ0. Nanoparticle doping leads to a slight decrease of elastic constant, which is in accordance to earlier observations. Additionally, a pronounced increase of initial tilt angle is found, presumably caused by NPs residing at the initial alignment layers of the test cell. Reproduced from Urbanski et al.[Citation63] with permission by Wiley-VCH.](/cms/asset/2595c743-3aa7-410b-8738-c6a6dab9d782/tlcy_a_1059586_f0005_c.jpg)
Figure 6. Fitting results for silane-stabilised gold NPs with mesogenic corona in the host FELIX-2900-03. (a) Elastic constant Κ11 for splay deformations. (b) Initial tilt angle θ0. Nanoparticle doping is found to decrease the elastic constant. At low doping concentrations the nanoparticle do not affect the initial tilt angle θ0, while higher doping concentrations increase θ0. For the sample containing 2.5% (w) of NPs, a correlation between the increase of pretilt angle and the decrease of elastic constant is found: When at low temperatures the tilt angle is high, the elastic constant of the dispersion is comparable to the values of the pristine host. With decreasing tilt angle at higher temperatures the elastic constant also decreases, which indicates a movement of particles from the interface to the bulk. Reproduced from Urbanski et al.[Citation63] with permission by Wiley-VCH.
![Figure 6. Fitting results for silane-stabilised gold NPs with mesogenic corona in the host FELIX-2900-03. (a) Elastic constant Κ11 for splay deformations. (b) Initial tilt angle θ0. Nanoparticle doping is found to decrease the elastic constant. At low doping concentrations the nanoparticle do not affect the initial tilt angle θ0, while higher doping concentrations increase θ0. For the sample containing 2.5% (w) of NPs, a correlation between the increase of pretilt angle and the decrease of elastic constant is found: When at low temperatures the tilt angle is high, the elastic constant of the dispersion is comparable to the values of the pristine host. With decreasing tilt angle at higher temperatures the elastic constant also decreases, which indicates a movement of particles from the interface to the bulk. Reproduced from Urbanski et al.[Citation63] with permission by Wiley-VCH.](/cms/asset/80850ebd-376a-49ef-8a1a-399d49677d2f/tlcy_a_1059586_f0006_c.jpg)
Figure 7. Experimental data for dispersions containing dodecylthiol-capped gold NPs in the nematic host 5CB showing the influence of polarisation effects on the threshold voltage VTh of the Fréedericksz-transition. (a) Dielectric spectroscopy measurements showing Maxwell–Wagner–Sillars polarisation peaks in the kHz region for nanoparticle doped samples. (b) Experimental data proving a strong increase of threshold VTh below the resonance frequency (dashed line) of the MWS-relaxation. (c) Measurements of threshold voltage VTh at a fixed frequency of 1 kHz. The strong increase of threshold with increasing doping concentration is caused by a shift of the MWS-resonance with increasing metal content to higher frequencies.
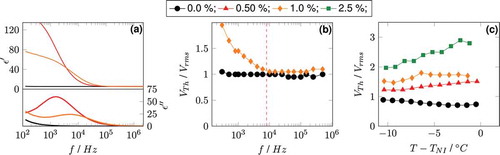
Figure 8. Plots of the dielectric anisotropy Δε (a) and threshold voltage VTh (b) for dispersions of silanised gold NPs in the apolar host FELIX-2900-03. For this NP/LC combination, nanoparticle doping clearly improves the electro-optic performance compared to the pristine host, leading to increased dielectric anisotropy and decreased driving voltages. Reproduced with permission from Mirzaei et al.[Citation75]
![Figure 8. Plots of the dielectric anisotropy Δε (a) and threshold voltage VTh (b) for dispersions of silanised gold NPs in the apolar host FELIX-2900-03. For this NP/LC combination, nanoparticle doping clearly improves the electro-optic performance compared to the pristine host, leading to increased dielectric anisotropy and decreased driving voltages. Reproduced with permission from Mirzaei et al.[Citation75]](/cms/asset/4f3abd27-a4a7-45e2-8017-3a122cb57627/tlcy_a_1059586_f0008_c.jpg)
Figure 9. Schematic illustration of our proposed switching mechanism leading to facilitated switching due to nanoparticle doping. Left: The ligand shell is deformed to a tactoidal shape due to anisometric interactions with the nematic host. Ligands along the uniaxial order of the host are fully unfolded and form two rigid poles, while ligands perpendicular to the nematic order are folded and form a soft equatorial ring. Right: Upon applying an external electric field the LC molecules rotate, whereas the particle remains unrotated. Instead, the previously folded ligands (black) unfold and the previously unfolded ligands fold (red), restoring the tactoidal shape of the nanoparticle parallel to the uniaxial order of LC molecules.
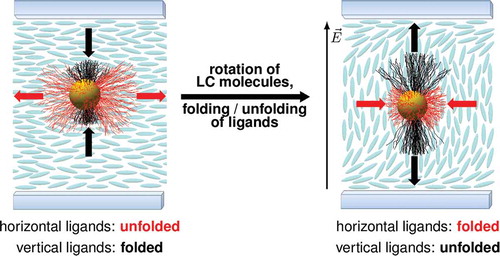
Figure 10. Illustrations of three degrees of dispersibility identified by the dependence of the capacitance (C) and light transmission (I) between crossed polarisers on reduced voltage. Left: Poor dispersibility leads to an expulsion of particles to the substrates and induces homeotropic alignment. Centre: Intermediate dispersibility affects the surface tilt angle and blurs the threshold of the field-dependent capacitance and light transmission responses. Right: Good dispersibility leads to the formation of homogeneous dispersions with a well-defined threshold for the Fréedericksz-effect. Reproduced from Urbanski et al. [Citation65] with permission by Wiley-VCH.
![Figure 10. Illustrations of three degrees of dispersibility identified by the dependence of the capacitance (C) and light transmission (I) between crossed polarisers on reduced voltage. Left: Poor dispersibility leads to an expulsion of particles to the substrates and induces homeotropic alignment. Centre: Intermediate dispersibility affects the surface tilt angle and blurs the threshold of the field-dependent capacitance and light transmission responses. Right: Good dispersibility leads to the formation of homogeneous dispersions with a well-defined threshold for the Fréedericksz-effect. Reproduced from Urbanski et al. [Citation65] with permission by Wiley-VCH.](/cms/asset/18c5c1e0-45c9-49a2-bef8-6bdb3e7c7cc9/tlcy_a_1059586_f0010_c.jpg)