3,683
Views
7
CrossRef citations to date
0
Altmetric
Regular Articles

Emotion work as a source of employee well- and ill-being: the moderating role of service interaction type

ORCID Icon, ORCID Icon & ORCID Icon
Pages 850-871 | Received 09 Mar 2020, Accepted 05 Jan 2021, Published online: 28 Jan 2021

Figures & data

Figure 1. Measurement of service interaction type based on the typology by Mills and Margulies (Citation1980) and scoring examples from the expert ratings.
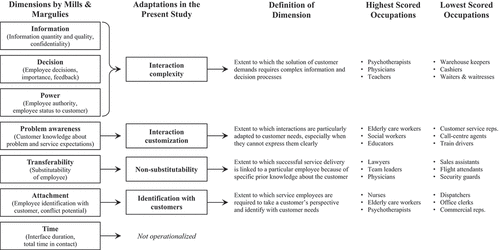
Figure 1. Measurement of service interaction type based on the typology by Mills and Margulies (Citation1980) and scoring examples from the expert ratings.

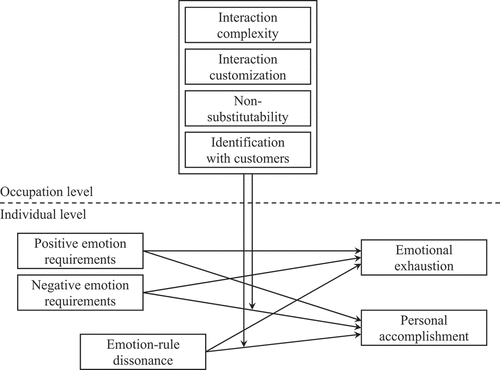
Figure 2. Examination model.

Figure 2. Examination model.

Table 1. Summary of demographic sample characteristics and variations of measurements per study

Table 2. Means, standard deviations, internal consistencies, and intercorrelations among study variables

Table 3. Results of MSEM models predicting emotional exhaustion and personal accomplishment

Figure 3. Illustration of simple slopes for negative emotion requirements and customer interaction characteristics with values +/ – 1 SD and +/ – 2 SD. a This coefficient is greater than 1.96 times its standard error. It would therefore be significant in a two-tailed test. However, we do not declare this coefficient as significant because the slope is contrary to our hypothesis, which was tested with a one-tailed test.
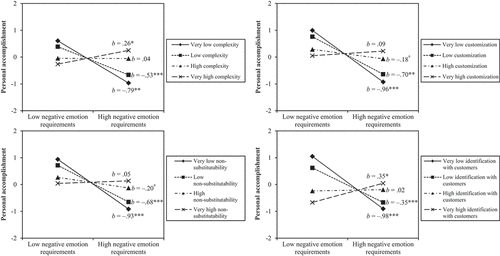
* p < .05. ** p < .01. *** p < .001 (one-tailed).
Figure 3. Illustration of simple slopes for negative emotion requirements and customer interaction characteristics with values +/ – 1 SD and +/ – 2 SD. a This coefficient is greater than 1.96 times its standard error. It would therefore be significant in a two-tailed test. However, we do not declare this coefficient as significant because the slope is contrary to our hypothesis, which was tested with a one-tailed test.

Figure 4. Illustration of simple slopes for emotion-rule dissonance and customer interaction characteristics with values +/ – 1 SD and +/ – 2 SD.
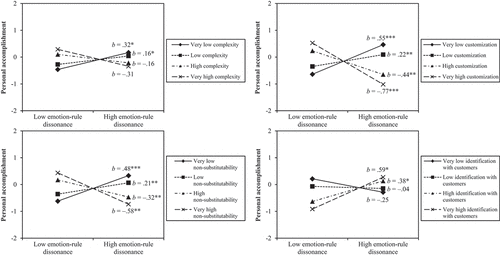
* p < .05. ** p < .01. *** p < .001 (one-tailed).
Figure 4. Illustration of simple slopes for emotion-rule dissonance and customer interaction characteristics with values +/ – 1 SD and +/ – 2 SD.