
Figures & data
Table 1. Statements examined in the survey. Each statement represents the policies, understandings and approaches to the specific group considered.
Table 2. Mean ratings, M, of statements and standard deviation, SD, given in parentheses.
Table 3. Percentage agreement with statements and average percentage agreement across all statements (bottom row).
Figure 1. Survey answers (percentages). Legend: 1 = Extremely different/Extremely inaccurate; 2 = different/inaccurate; 3 = Somewhat similar/Somewhat accurate; 4 = similar/accurate; 5 = Extremely similar/Extremely accurate; 6 = not sure.
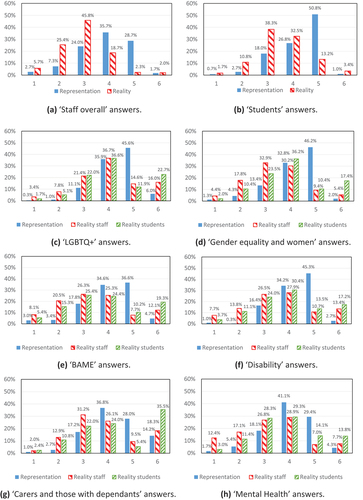
Table 4. T-test results comparing ‘representation’ vs. ‘reality’ for staff and for students.
Table 5. T-test results comparing ‘reality’ for staff vs. ‘reality’ for students.