Figures & data
Figure 1. BJP vote shares in the 2009 and 2014 federal elections for 29 states.
Notes: See Table A1 in the Annex for the full names and classification of the states.
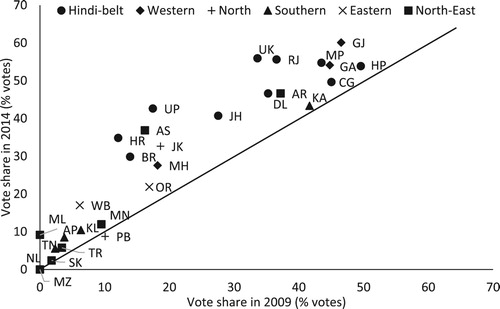
Figure 2. (A) Vote share in federal elections per type of party (1952–2014). (B) Seat share in federal elections per type of party (1952–2014).
Notes: Vote and seat shares are weighted by the size of the state electorate. See Table A2 in the onine annex for a classification of parties.
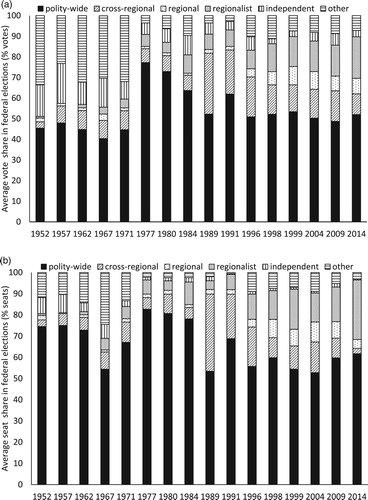
Figure 3. (A) Vote share in federal elections per type of party (1952–2014): Hindi Belt states. (B) Seat share in federal elections per type of party (1952–2014): Hindi Belt states.
Notes: Shown are vote and seat shares weighted by the size of the electorate of the Hindi Belt states: 6 for 1952–1962; 7 for 1967–1999; 10 for 2004–2014. See Table A1 in the online annex for a classification of states and see Table A2 in the online annex for a classification of parties.
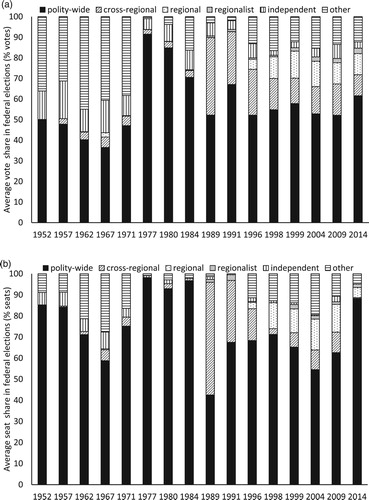
Table 1. Vote shares in regional elections.
Table 2. Party competition in 30 states since 2004.
Table 3. Summary of party competition in 30 states since 2004.
Figure 4. BJP vote shares in the 2014 federal election and subsequently held state elections.
Notes: See Table A1 in the Annex for the full names and classification of the states. Madhya Pradesh, Mizoram, and Rajasthan are not shown because these states did yet have held their state elections at the writing of this election article.
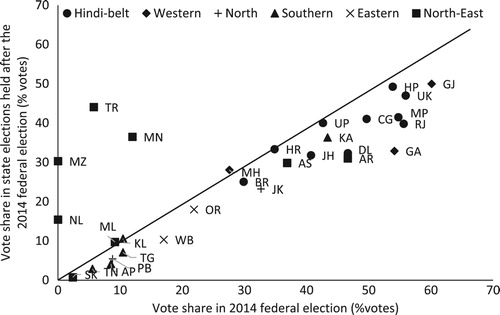
Table 4. Party nationalization scores.
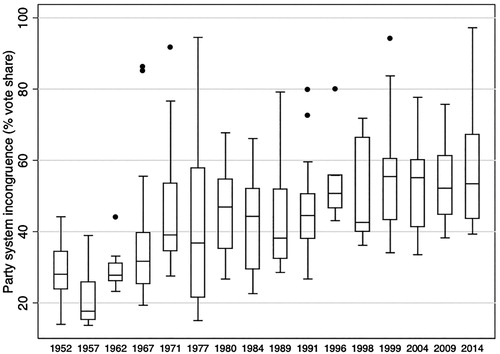
Figure 5. Party system congruence between federal and state elections since 1952.
Notes: Shown are dissimilarity scores (percent votes) between a federal election and subsequently held state elections held at the same time or after the federal election but before the next federal election. Dissimilarity scores are calculated based on Schakel (Citation2013). A box plot distributes values into four groups with each 25 per cent of the observations. The values of the first quartile of observations lies in between the bottom line of the box and lower whisker, the second quartile in between the bottom line of the box and the middle line of the box which is the median, the third quartile between the median and the upper line of the box, and the fourth quartile between the upper line of the box and upper whisker. Dots are outliers which have values more than 3/2 times of the upper quartile.