
Figures & data
Figure 1. Empty distribution grid used in t2. Cards on top are placed on the grid through drag-and-drop.
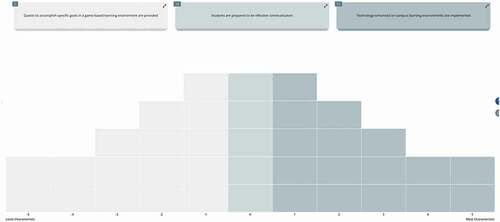
Table 1. Participants’ correlation and considerable changes between t1 and t2.
Table 2. Q set consisting of 37 items ordered from most to the least considerable changes between t1 and t2.